Distortion of finished parts during machining is a significant problem which typically results from release and redistribution of residual stress in the material once the part is unclamped from the machine table. If not accounted for,
This case study focuses on machining modeling of a representative aircraft specimen using multi-step finite element analysis. Machining modeling was used to identify a machining strategy that requires less machine time (e.g., fewer part set-ups) to arrive at the final geometry, while also reducing the distortion of the finished part. The results illustrate how multi-step machining models can be used to provide upfront estimates of distortion, as well as guidance to optimize machining processes and obtain improved machining outcomes.
The part geometry considered in this case study is shown in Figure 1, and was designed to be representative of an aircraft part. The overall dimensions are 25 x 10 x 2.5 inches. The pockets, stiffener walls, holes, and tapering along the 25 inch dimension and 2.5 inch dimension provide a complex and representative geometry. The part is assumed to be machined from a 27 x 12 x 3.5 inch plate of aluminum alloy 7050-T7451 (stress relieved by stretching). While this material state typically exhibits low levels of residual stress, distortion during machining can still occur depending on the part geometry, machining strategy, and required tolerances.
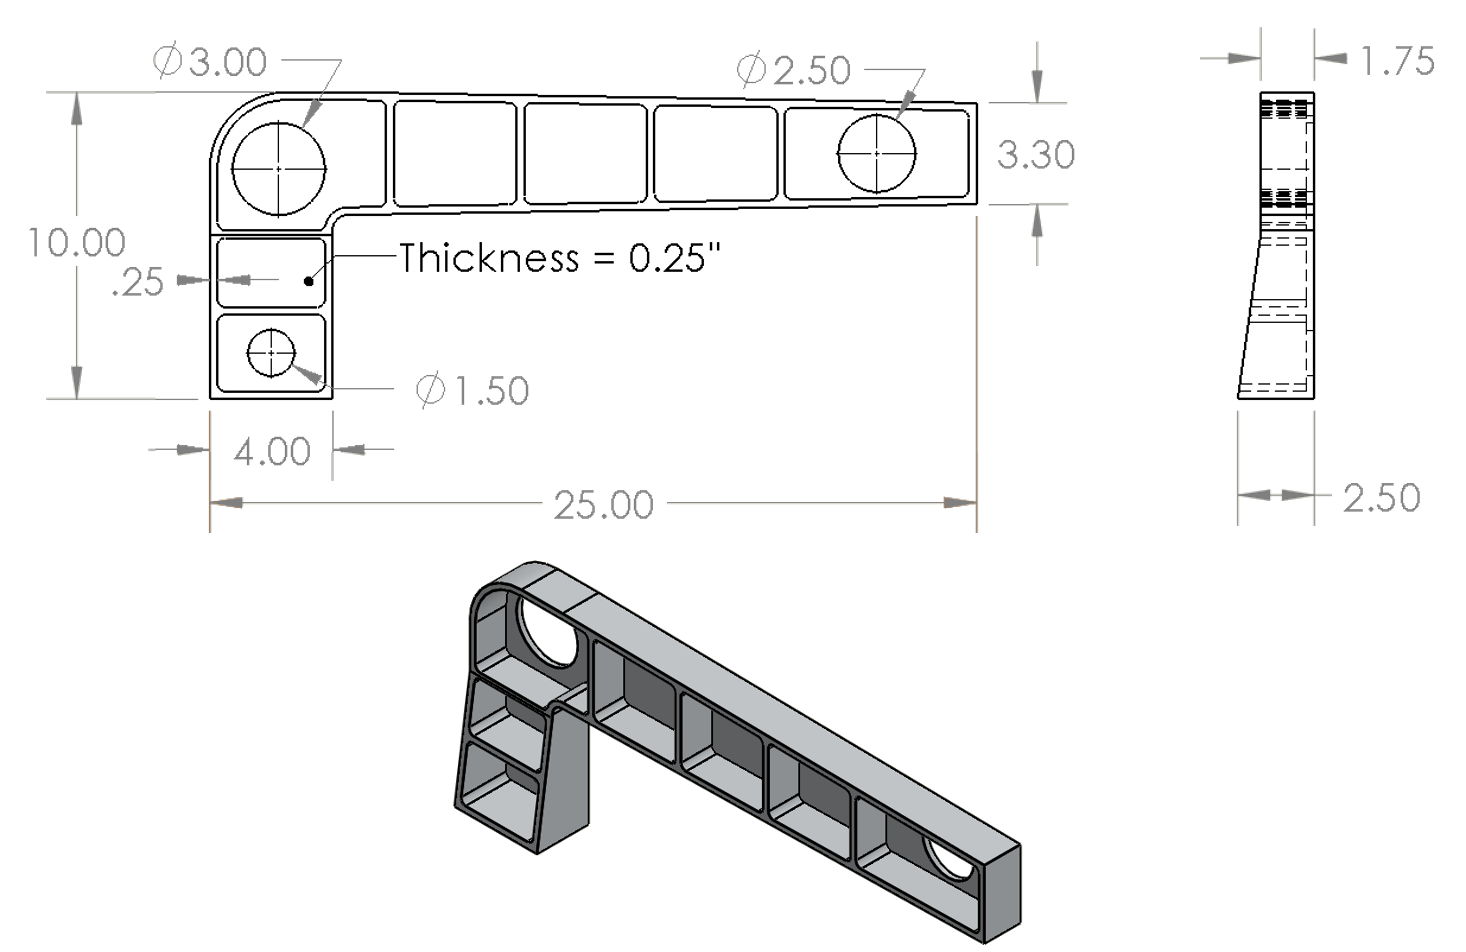
Part geometry (dimensions in inches)
The plate considered for machining this part provides extra material coverage on all sides. Figure 2 shows the amount of machining cover on each side, given the part is aligned with the mid-thickness of the stock plate with equal spacing relative to the sides of the stock. One inch of extra material is available on all sides when looking from a top view, while one-half inch of extra material is available along the thickness direction.
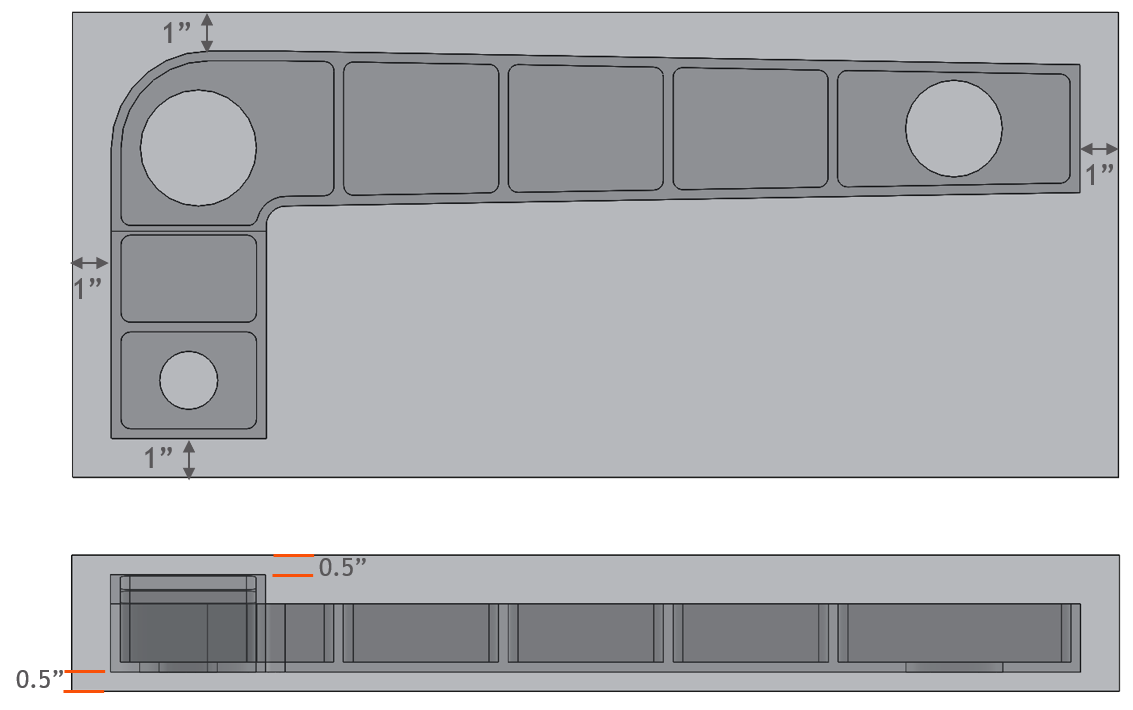
Part geometry within stock material when placed at the mid-thickness of the plate
The assumed residual stress in the stock plate material is shown in Figure 3. This is based on slitting method results published in [1] for 3-inch-thick plate of aluminum alloy 7050-T7451. The residual stress distributions are relatively symmetric and were normalized and scaled for the specific stock plate thickness used in the current study (3.5 inches). The rolling direction of the stock plate was assumed to be along the 27-inch dimension of the plate.
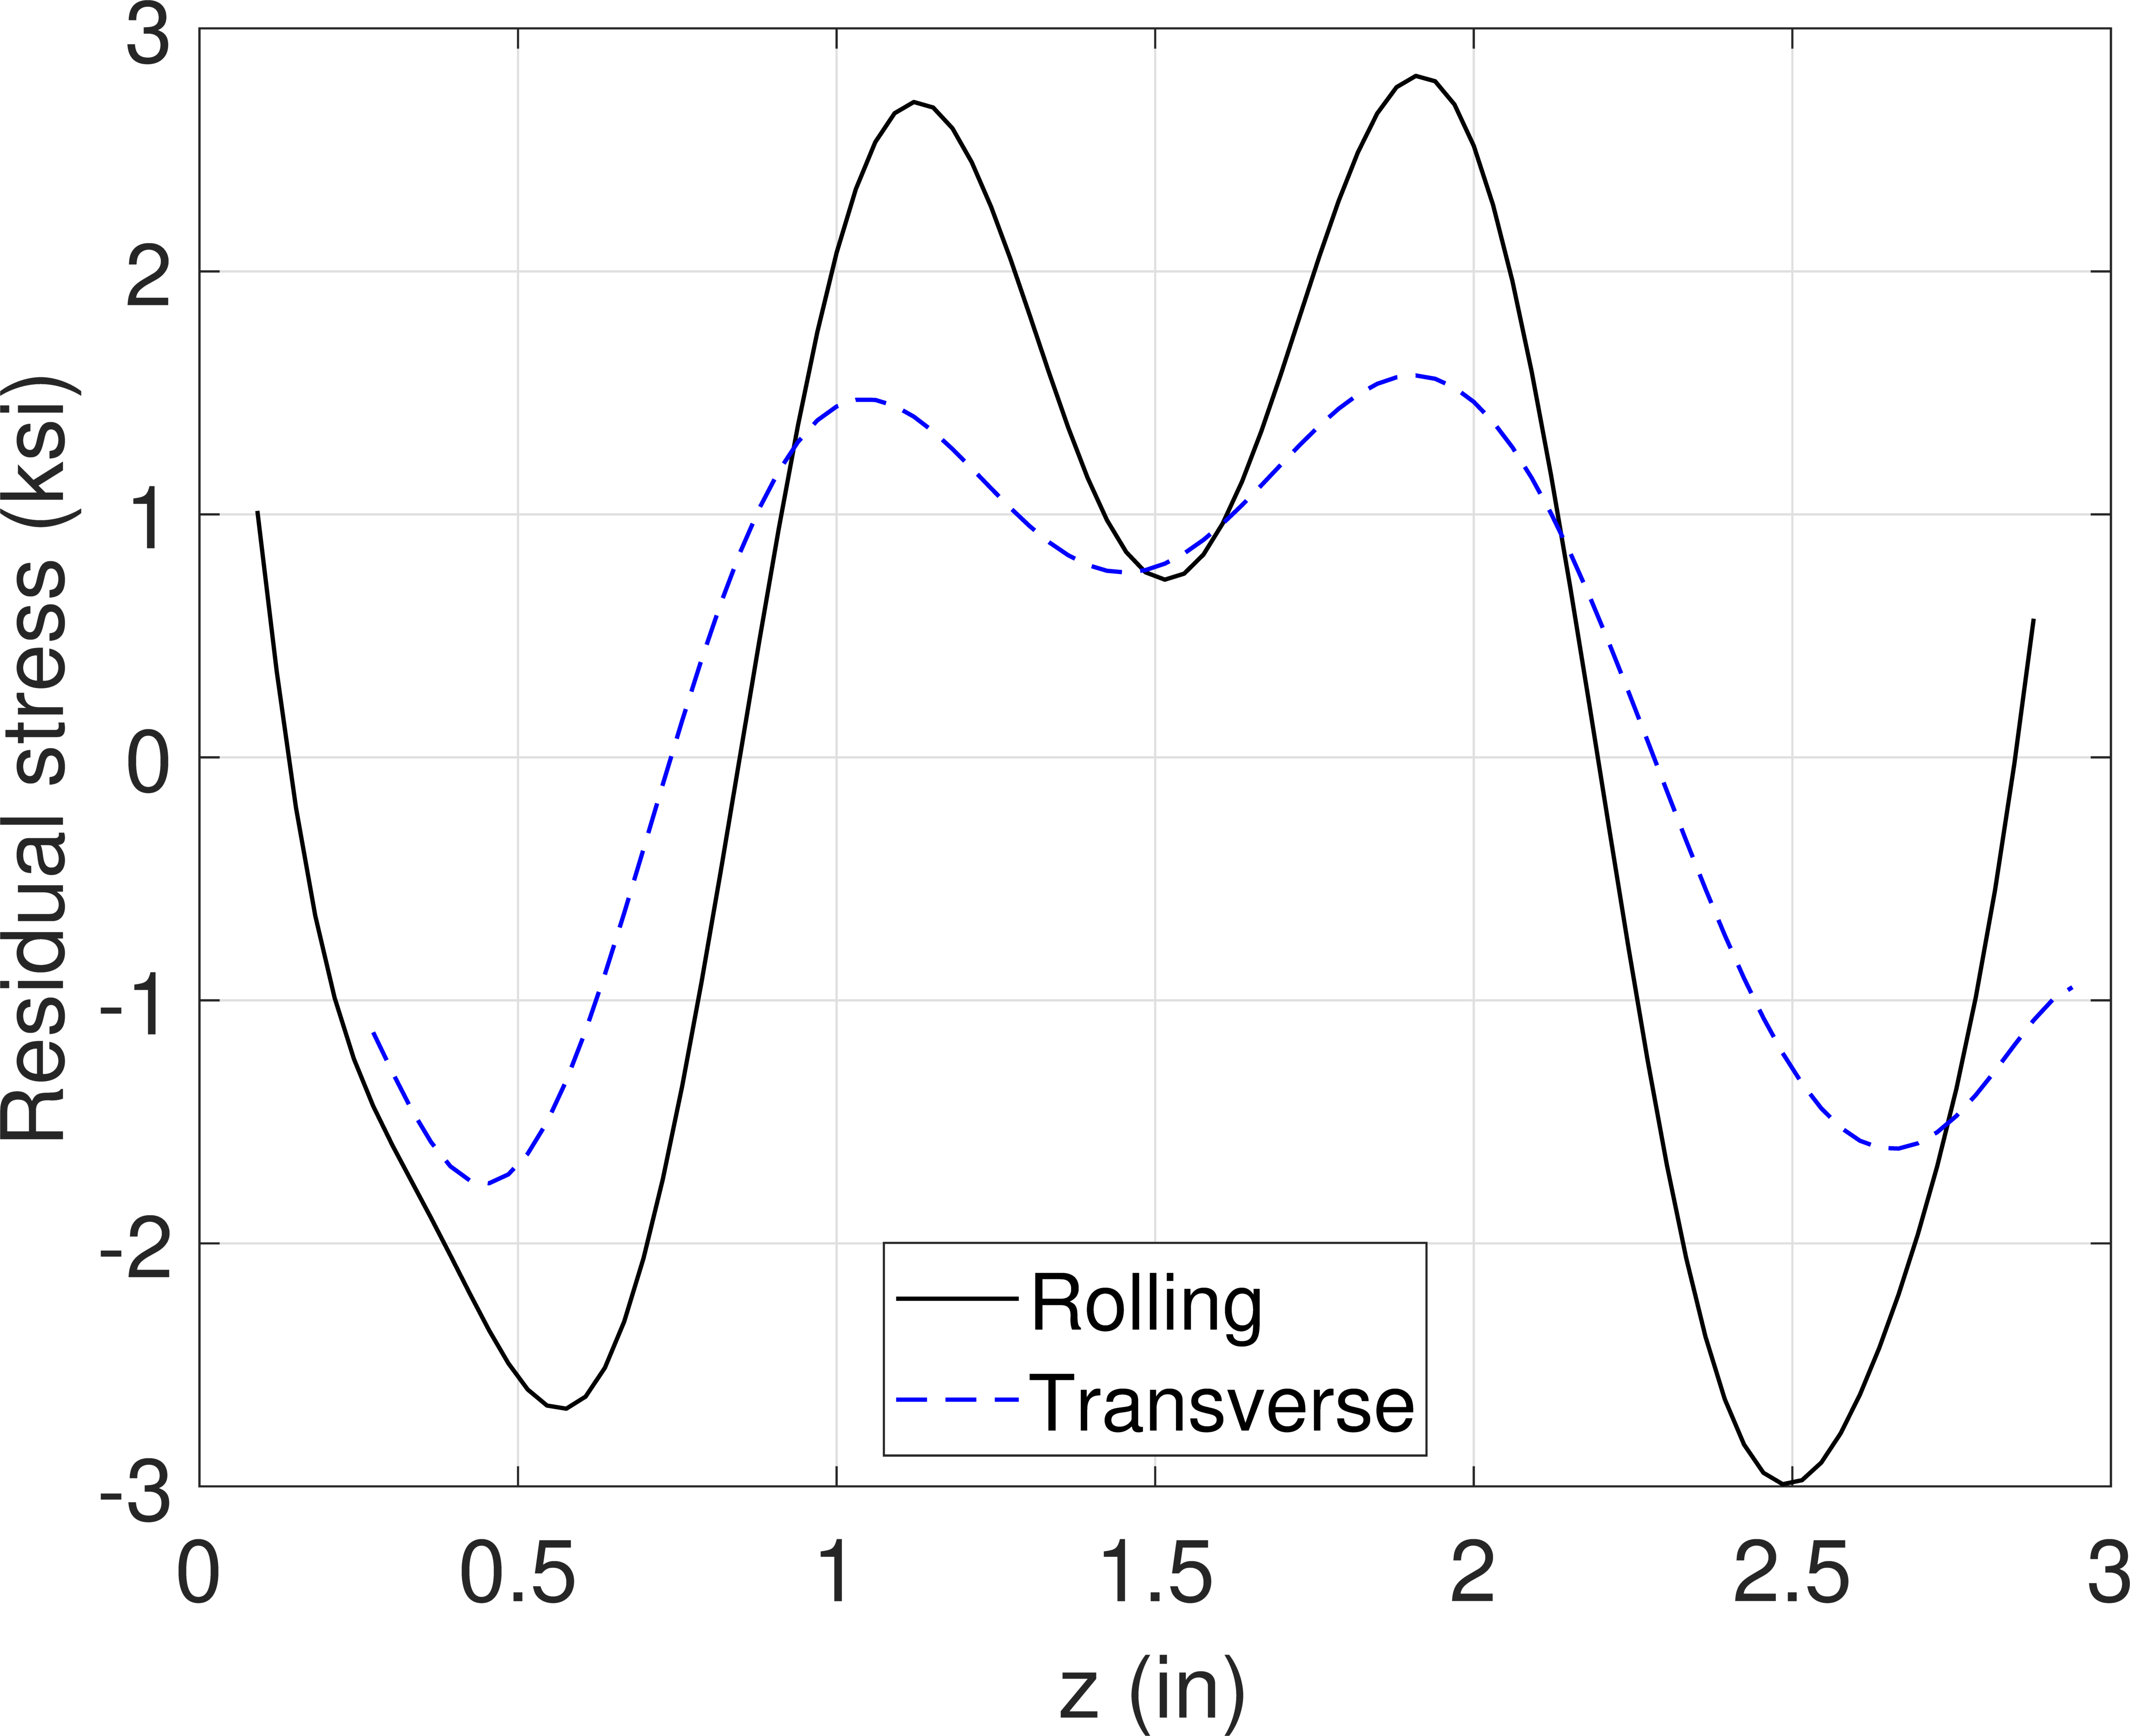
Residual stress measured in aluminum alloy 7050-T7451 plate (adapted from [1])
The baseline machining strategy considered is illustrated in Figure 4, in which the part is placed near the top surface of plate. Step 1 includes a rough machining pass on the bottom surface of the plate to obtain a flat surface for subsequent machining. Then, the part is flipped on the machine table. Step 2 involves an initial rough machining of the pockets and stiffener walls. Step 3 flips the part once again and finalizes machining of the bottom flat surface of the part. Finally, the part is flipped for the last time, and machining of the pockets, holes, and stiffener walls is finalized to arrive at the final geometry. This machining strategy includes a total of 3 flips on the machine table.
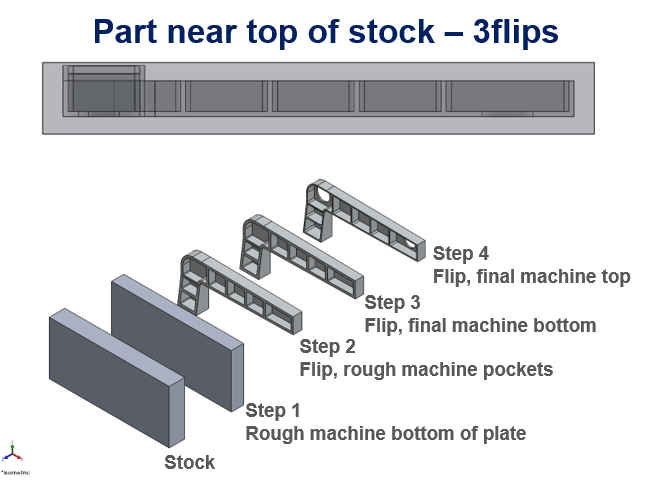
Part placement and baseline machining strategy
Multi-step finite element models were employed to obtain estimates of the distortion and residual stress at the end of each machining step. For brevity, the displacement of the finished part only (step 4) is shown here. Figure 5 shows a contour plot of the displacement along the z-axis (U3, perpendicular to the bottom flat surface of the part) on a scale that varies from -0.025 to 0.025 inches. The displacement U3 range (maximum minus minimum value) is about 0.030 inches. Maximum displacement is observed near the corner region of the part that contains the 3-inch diameter hole (shown in Figure 1).
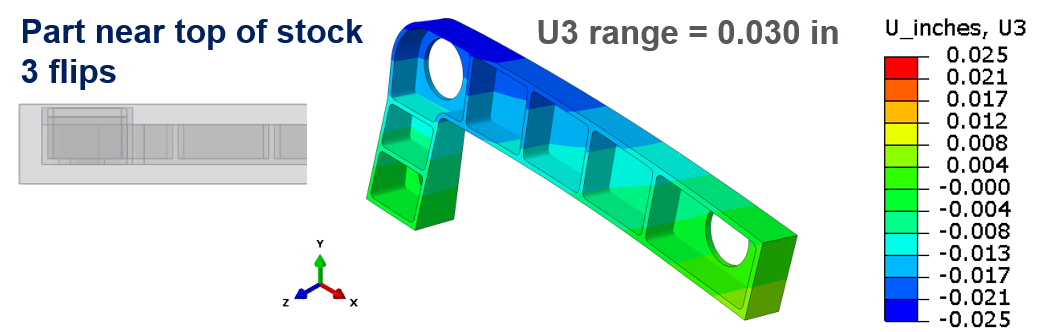
Contour plot of displacement along the z-axis (U3) for the finished part from the baseline strategy
Modeling was performed to simulate many different machining approaches. The optimal machining strategy places the part at the bottom surface of the stock plate as illustrated in Figure 6. The first step involves rough machining of the pockets and stiffener walls. The part is then flipped, and final-machined on the bottom flat surface. The second and final flip on the machine table provides the setup to final-machine the pockets, holes, and stiffener walls. This machining strategy uses a total of 2 flips (one less than the previous strategy).
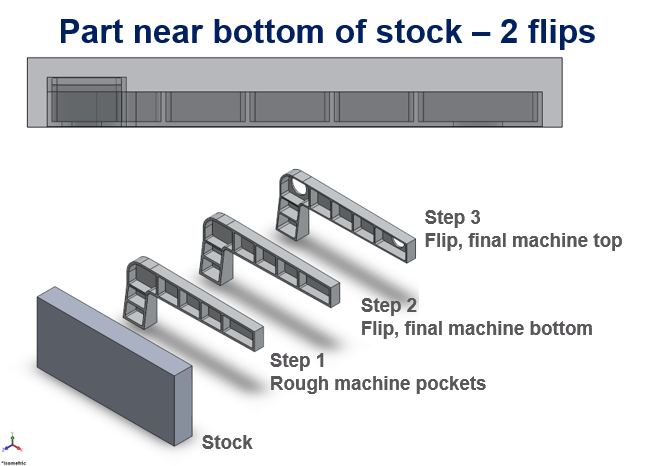
Part placement and optimized machining strategy
The part distortion for the optimized machining strategy is shown in Figure 7 (using the same color scale as in Figure 5). Compared to the baseline strategy (Figure 5), a different displacement pattern is observed, although the maximum values are near the same region (i.e., near the corner of the part with the 3-inch diameter hole). The displacement range is 0.013 inches for the optimized machining strategy, which is significantly lower than observed from the baseline approach (0.030 inches). It is important to note that the optimized strategy (which places the part near the bottom of the stock) not only provided a finished part with lower amount of distortion, it also required less machine time (fewer flips), which represents an improvement in efficiency of the machining process.
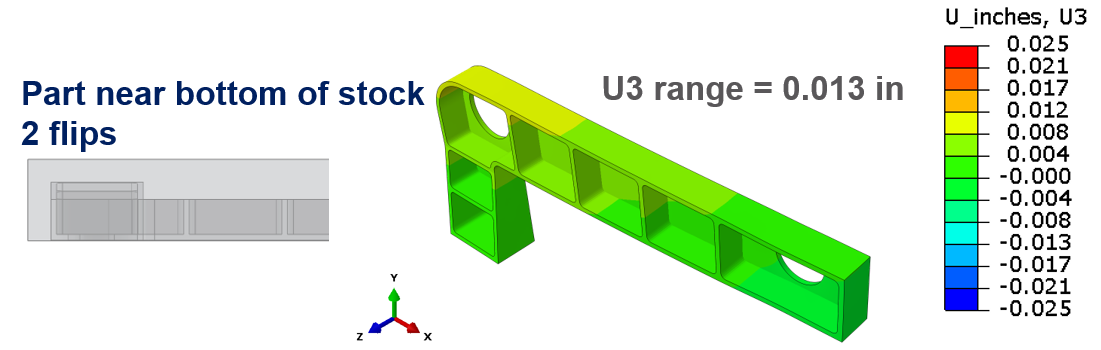
Contour plot of displacement along the z-axis for the finished part from the optimized strategy
This case study considered multi-step machining models of a representative aircraft specimen, including the residual stress in the incoming stock material, to assess the distortion of the finished part. Two different machining strategies were presented, which included differences in part placement within the stock material, and sequence of machining steps. The results identify an optimized machining strategy that uses fewer flips on the machine table (setups) to arrive at the final geometry, while also reducing the distortion of the finished part. The results illustrate how multi-step machining models can be used to provide upfront estimates of distortion and guidance to optimize machining processes in order to obtain improved outcomes. Please contact us for additional information.