The contour method is a residual stress measurement technique that provides a two-dimensional map of residual stress on a plane. Hill Engineering’s most recent case study explores how we determine the uncertainty in these measurements.
Continue reading Case Study: Contour Method UncertaintyTag: uncertainty
Search results for Hill Engineering blog posts containing the tag uncertainty
Contour method uncertainty
The contour method is a residual stress measurement technique that provides a two-dimensional map of residual stress on a plane. Hill Engineering’s uncertainty estimate for contour method measurements is summarized here. For additional information, refer to the references below.
The contour method uncertainty estimate accounts for two main, random uncertainty sources present in contour method measurements. This includes the uncertainty associated with random noise in the surface height profiles called the displacement error, and the uncertainty associated with choosing a specific analytical model to fit the surface profiles called the model error.
The displacement error is estimated using a Monte Carlo approach that applies normally distributed noise to the each of the original measured surfaces. The normally distributed noise is prescribed to have approximately the same magnitude as the surface roughness that arises from EDM cutting. Stress results are found using five different sets of random noise added to the surface height profiles, and the standard deviation of those five residual stress results at each spatial location is taken as the displacement error.
The model error is estimated by taking the standard deviation of the residual stress results using displacement surface profiles that have been fit with different analytical models (centered around what was determined to be the best fit). Each case uses a different number of fitting coefficients.
The total contour method uncertainty is then taken as the root-sum-square of the displacement and model errors with a minimum value of uncertainty set as a floor. The floor used is the mean of the total uncertainty (prior to the application of the floor), which is evaluated over a regular grid. The uncertainty estimate is assumed to have a normal distribution, which implies that one standard deviation represents a 68% confidence interval.
An illustrative example of the contour method uncertainty calculation is provided below from a measurement on a dissimilar metal welded plate.
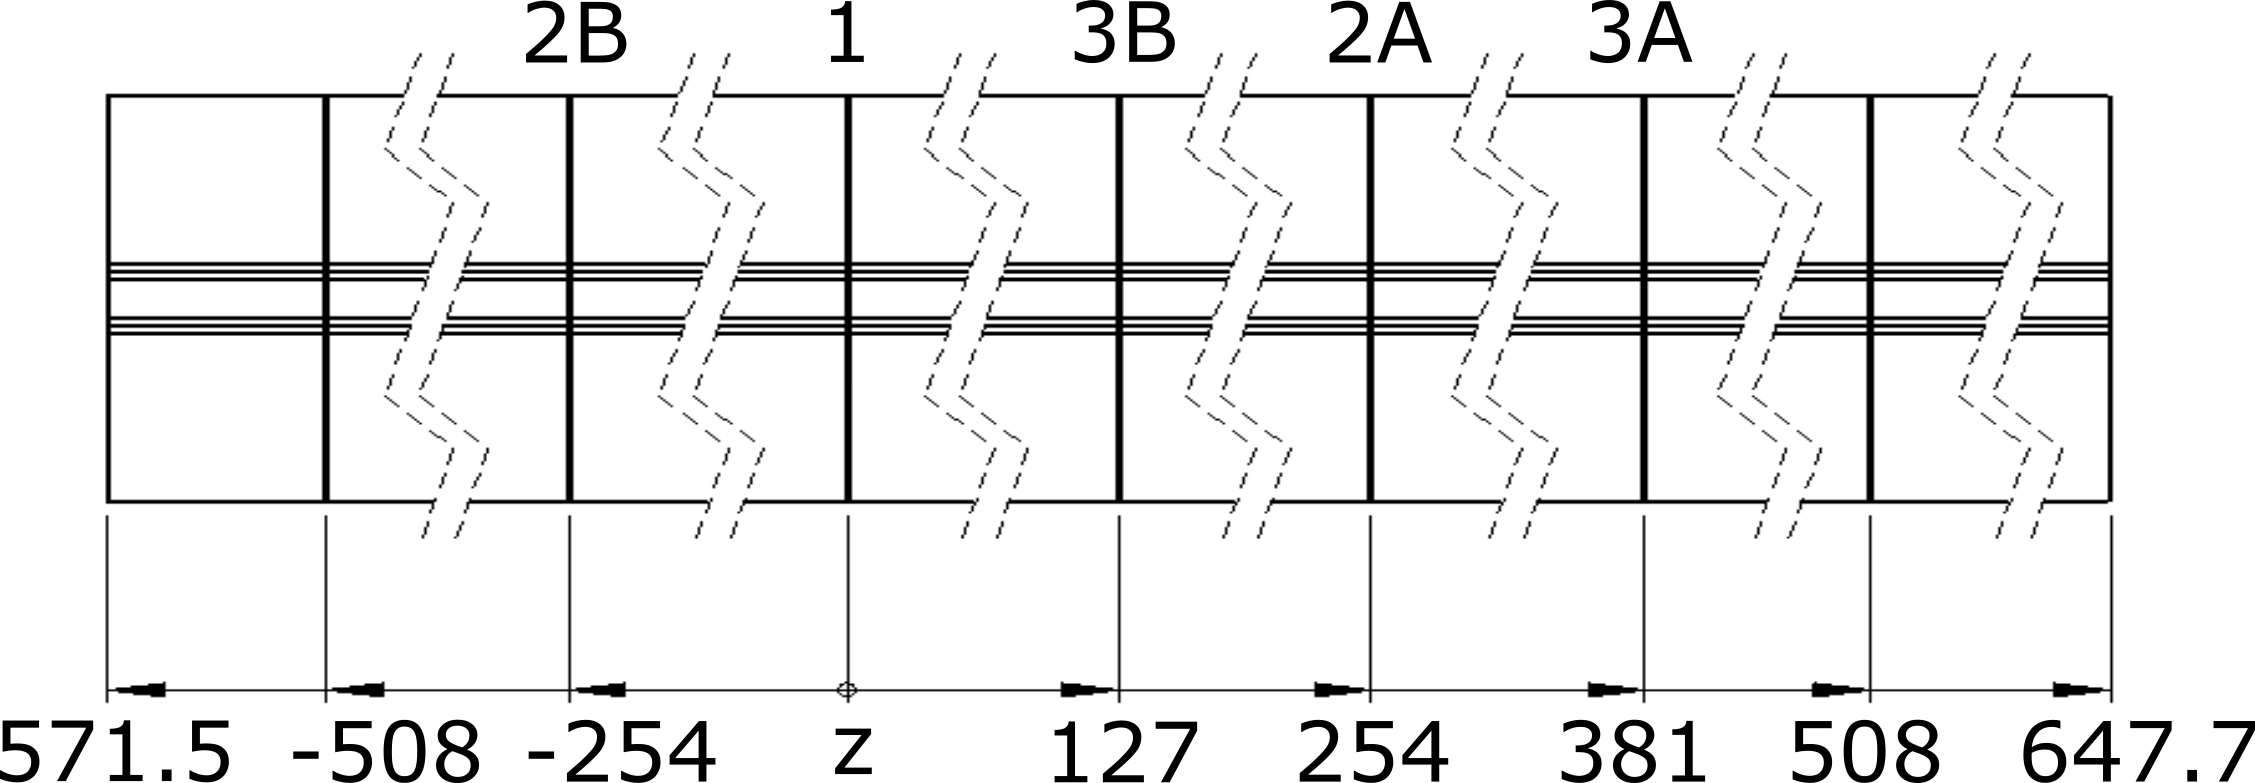
Stainless steel dissimilar metal dimensions and measurement locations (dimensions in mm)
The measured residual stress in the test specimen is shown below.
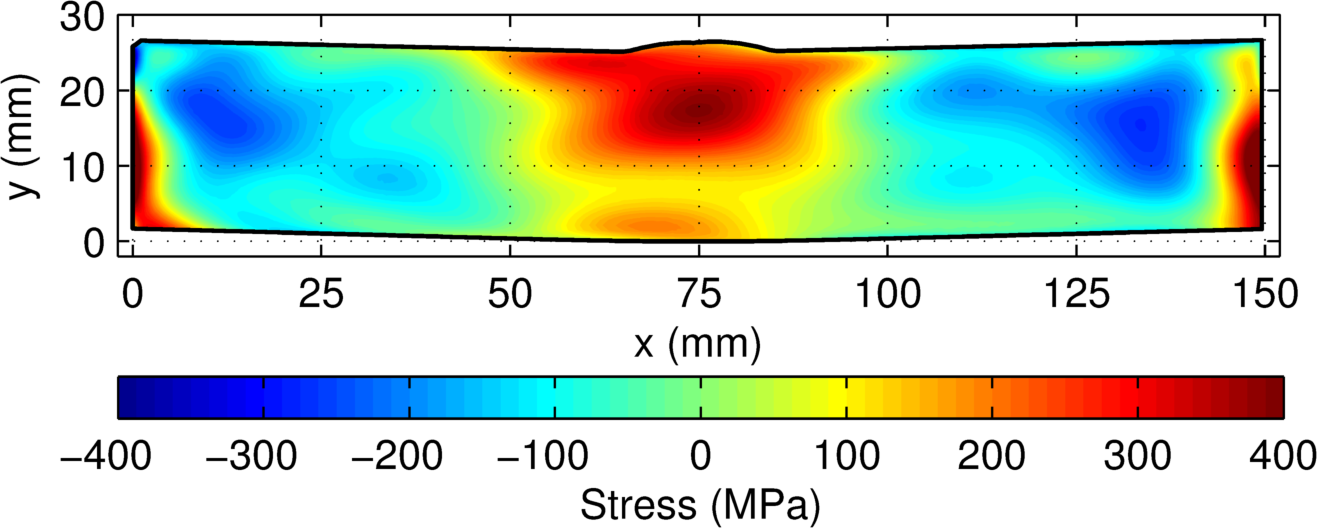
Measured residual stress (σzz)
The model error for the measurement (below) is largest along the part boundary (95th percentile is at 41.0 MPa). The displacement error (also shown below) is largest along the part boundary (95th percentile is at 11.8 MPa). The displacement error is much smaller than the model error. The total uncertainty has nearly the same distribution as the model error (95th percentile is at 42.5 MPa) with a 17.5 MPa floor covering most of the cross-section.
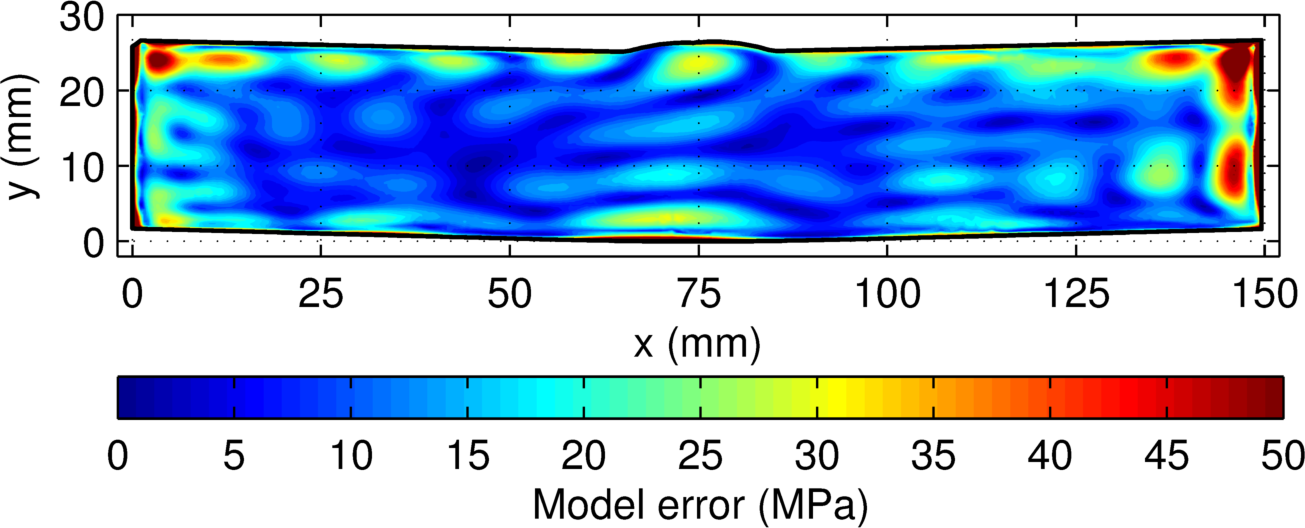
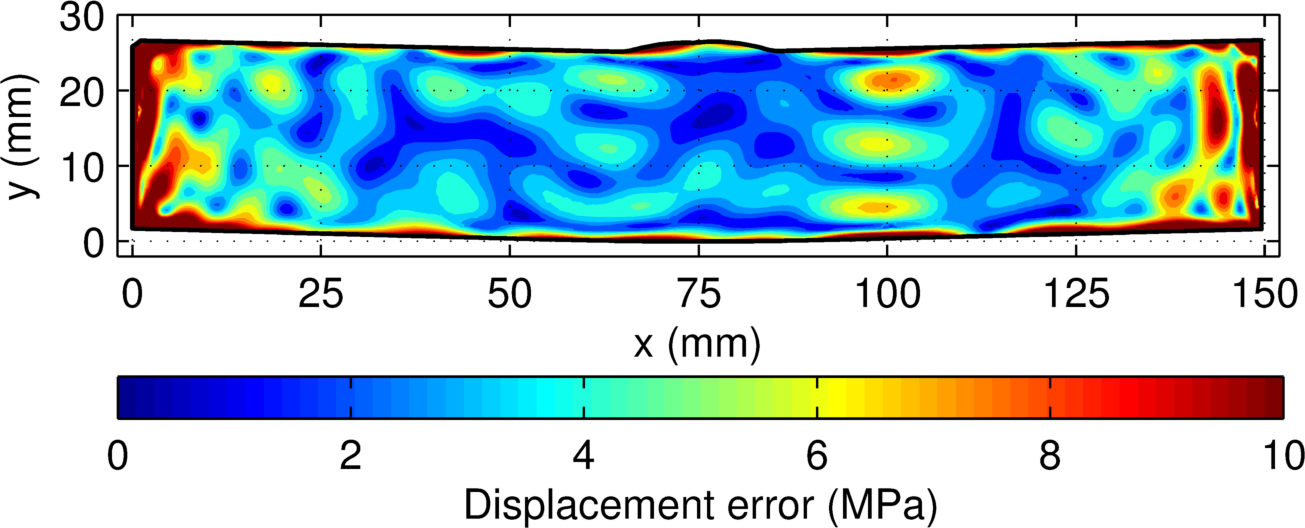
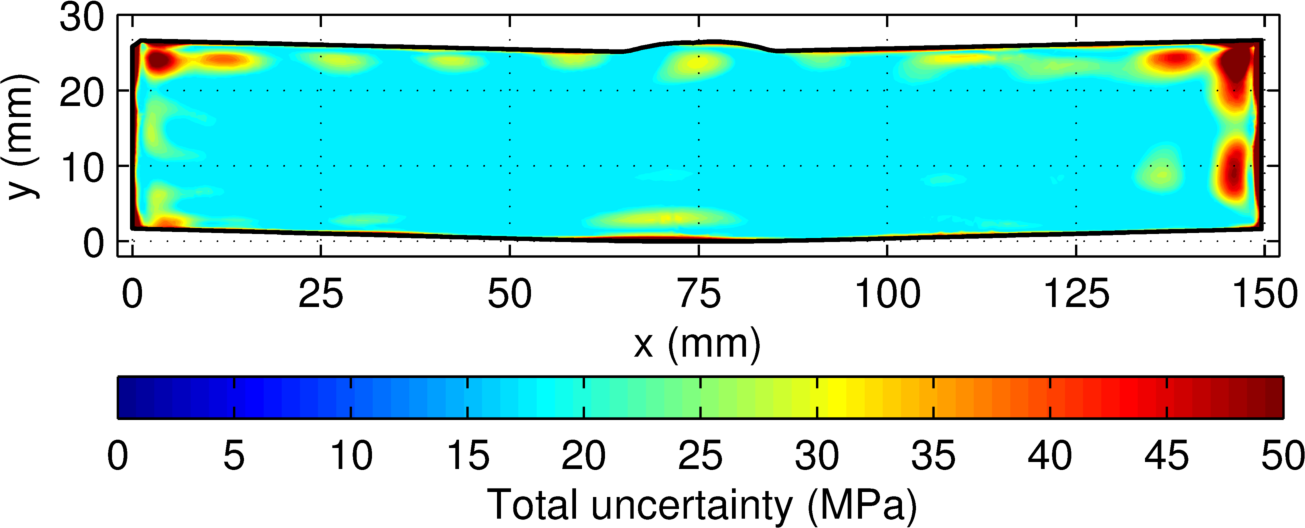
(top) Displacement error, (middle) model error, and (bottom) total uncertainty for the stainless steel DM welded samples
If you would like more information about using the contour method to determine a 2D map of residual stress in your parts please contact us.