Following the inputs from our user community, we continue to develop new capability in the Broad Application for Modeling Failure (BAMF) software. We are happy to announce the new version of BAMF (7.0) is now available, which includes several significant enhancements that improve the usability of BAMF and adds to the state-of-the-art capability not available in other fatigue analysis tools. Continue reading BAMF version 7.0 release
Category: Our Work
Search results for Hill Engineering blog posts under the subject category our work
Case Study: cold hole expansion process modeling
Cold hole expansion (Cx or cold expansion for short) of fastener holes is a technique that has been widely used in the aircraft industry to improve the fatigue performance of structural components. The cold hole expansion process introduces compressive residual stress near the vicinity of the hole that slows crack growth and can significantly improve fatigue performance. Continue reading Case Study: cold hole expansion process modeling
New publication – An Uncertainty Estimator for Slitting Method Residual Stress Measurements Including the Influence of Regularization
Hill Engineering recently published new research detailing our efforts to quantify uncertainty for slitting method residual stress measurements. This new approach provides a more accurate estimate of the measurement uncertainty associated with the slitting method, which is very helpful for probabilistic performance assessments. The paper is titled An Uncertainty Estimator for Slitting Method Residual Stress Measurements Including the Influence of Regularization and appears in Experimental Mechanics. The abstract text is available here along with a link to the publication. Continue reading New publication – An Uncertainty Estimator for Slitting Method Residual Stress Measurements Including the Influence of Regularization
Case Study: Cold hole expansion process modeling
Cold hole expansion (CX or cold expansion for short) of fastener holes is a technique that has been widely used in the aircraft industry to improve the fatigue performance of structural components. The cold hole expansion process introduces compressive residual stress near the vicinity of the hole that slows crack growth and can significantly improve fatigue performance. The process induces plastic deformation near the hole from pulling an oversized mandrel through the hole. The elastic recovery of the surrounding material results in compressive residual stress near the hole bore surface that is balanced by tensile residual stress farther from the hole. The benefits of cold expansion on fatigue performance have been illustrated in several research studies. A correlation of fatigue crack growth at cold expanded holes is illustrated in [1].
This case study focuses on nonlinear process modeling of cold expansion using finite element analysis. An aluminum coupon with dimensions 50.8 x 50.8 x 6.35 mm (2.0 x 2.0 x 0.25 inch) and a hole in the center of diameter 12.12 mm (0.477 inch) is considered. The hole undergoes a 3.16% applied expansion during the cold hole expansion process, i.e., at maximum expansion, the hole radius is enlarged by 3.16%. Figure 1 shows the coupon geometry.
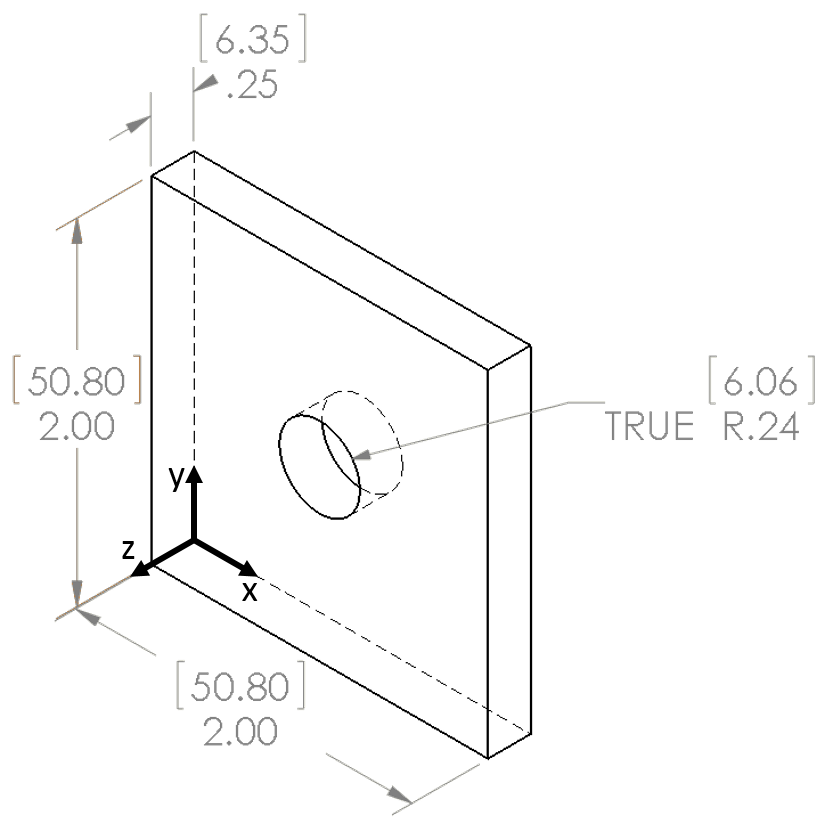
Coupon geometry used for cold hole expansion process modeling. Non-bracketed dimensions are in inches and bracketed dimensions are in mm.
The analysis considers the elastic-plastic behavior of the material, and uses a true stress-strain curve obtained from experimental tests using the specific material considered here. The material curve describes the material behavior under loading, and characterizes the hardening of the material as it is loaded past its initial yield strength.
Typically, fatigue cracks initiate at the edge of fastener holes. The hoop residual stress combines with applied loading to alter the crack driving force, and is important in a fatigue crack growth analysis considering cold expanded holes. The process model used here provides hoop residual stress as shown in Figure 2. A through-thickness map taken at the y = 25.4 mm (1.0 inch) plane is shown in Figure 2a, where high compressive residual stress is observed near the edges of the hole, while tensile residual stress arises farther from the hole edge to satisfy mechanical equilibrium. Figure 2b also shows the hoop residual stress, but at a xy midplane (z = 3.175 mm (0.125 inch)). The high compressive residual stress is localized near the hole edge, and is approximately axisymmetric. Taking a line plot of the hoop residual stress along a specified path provides more quantitative results, as illustrated in Figure 2c, where the path taken is at the y = 25.4 mm plane and at the mid-thickness of the plate (z = 3.175 mm (0.125 inch)). The curve in this plot is for the right side of the hole only (x > 30 mm).
The distribution shows peak compressive residual stress at the hole edge that decays and eventually becomes tensile. The peak compressive residual stress at the hole edge is -480 MPa (approximately -70 ksi). The size of the compressive residual stress zone, i.e., the distance at which the RS crosses 0 is about 4.4 mm (0.17 inch), which corresponds to about 0.7R (R = radius of the hole). Beyond the compressive residual stress zone, tensile residual stress develops with peak of about 115 MPa (approximately 17 ksi) at 7.2 mm (0.28 inch) away from the hole edge, which corresponds to 1.1R.
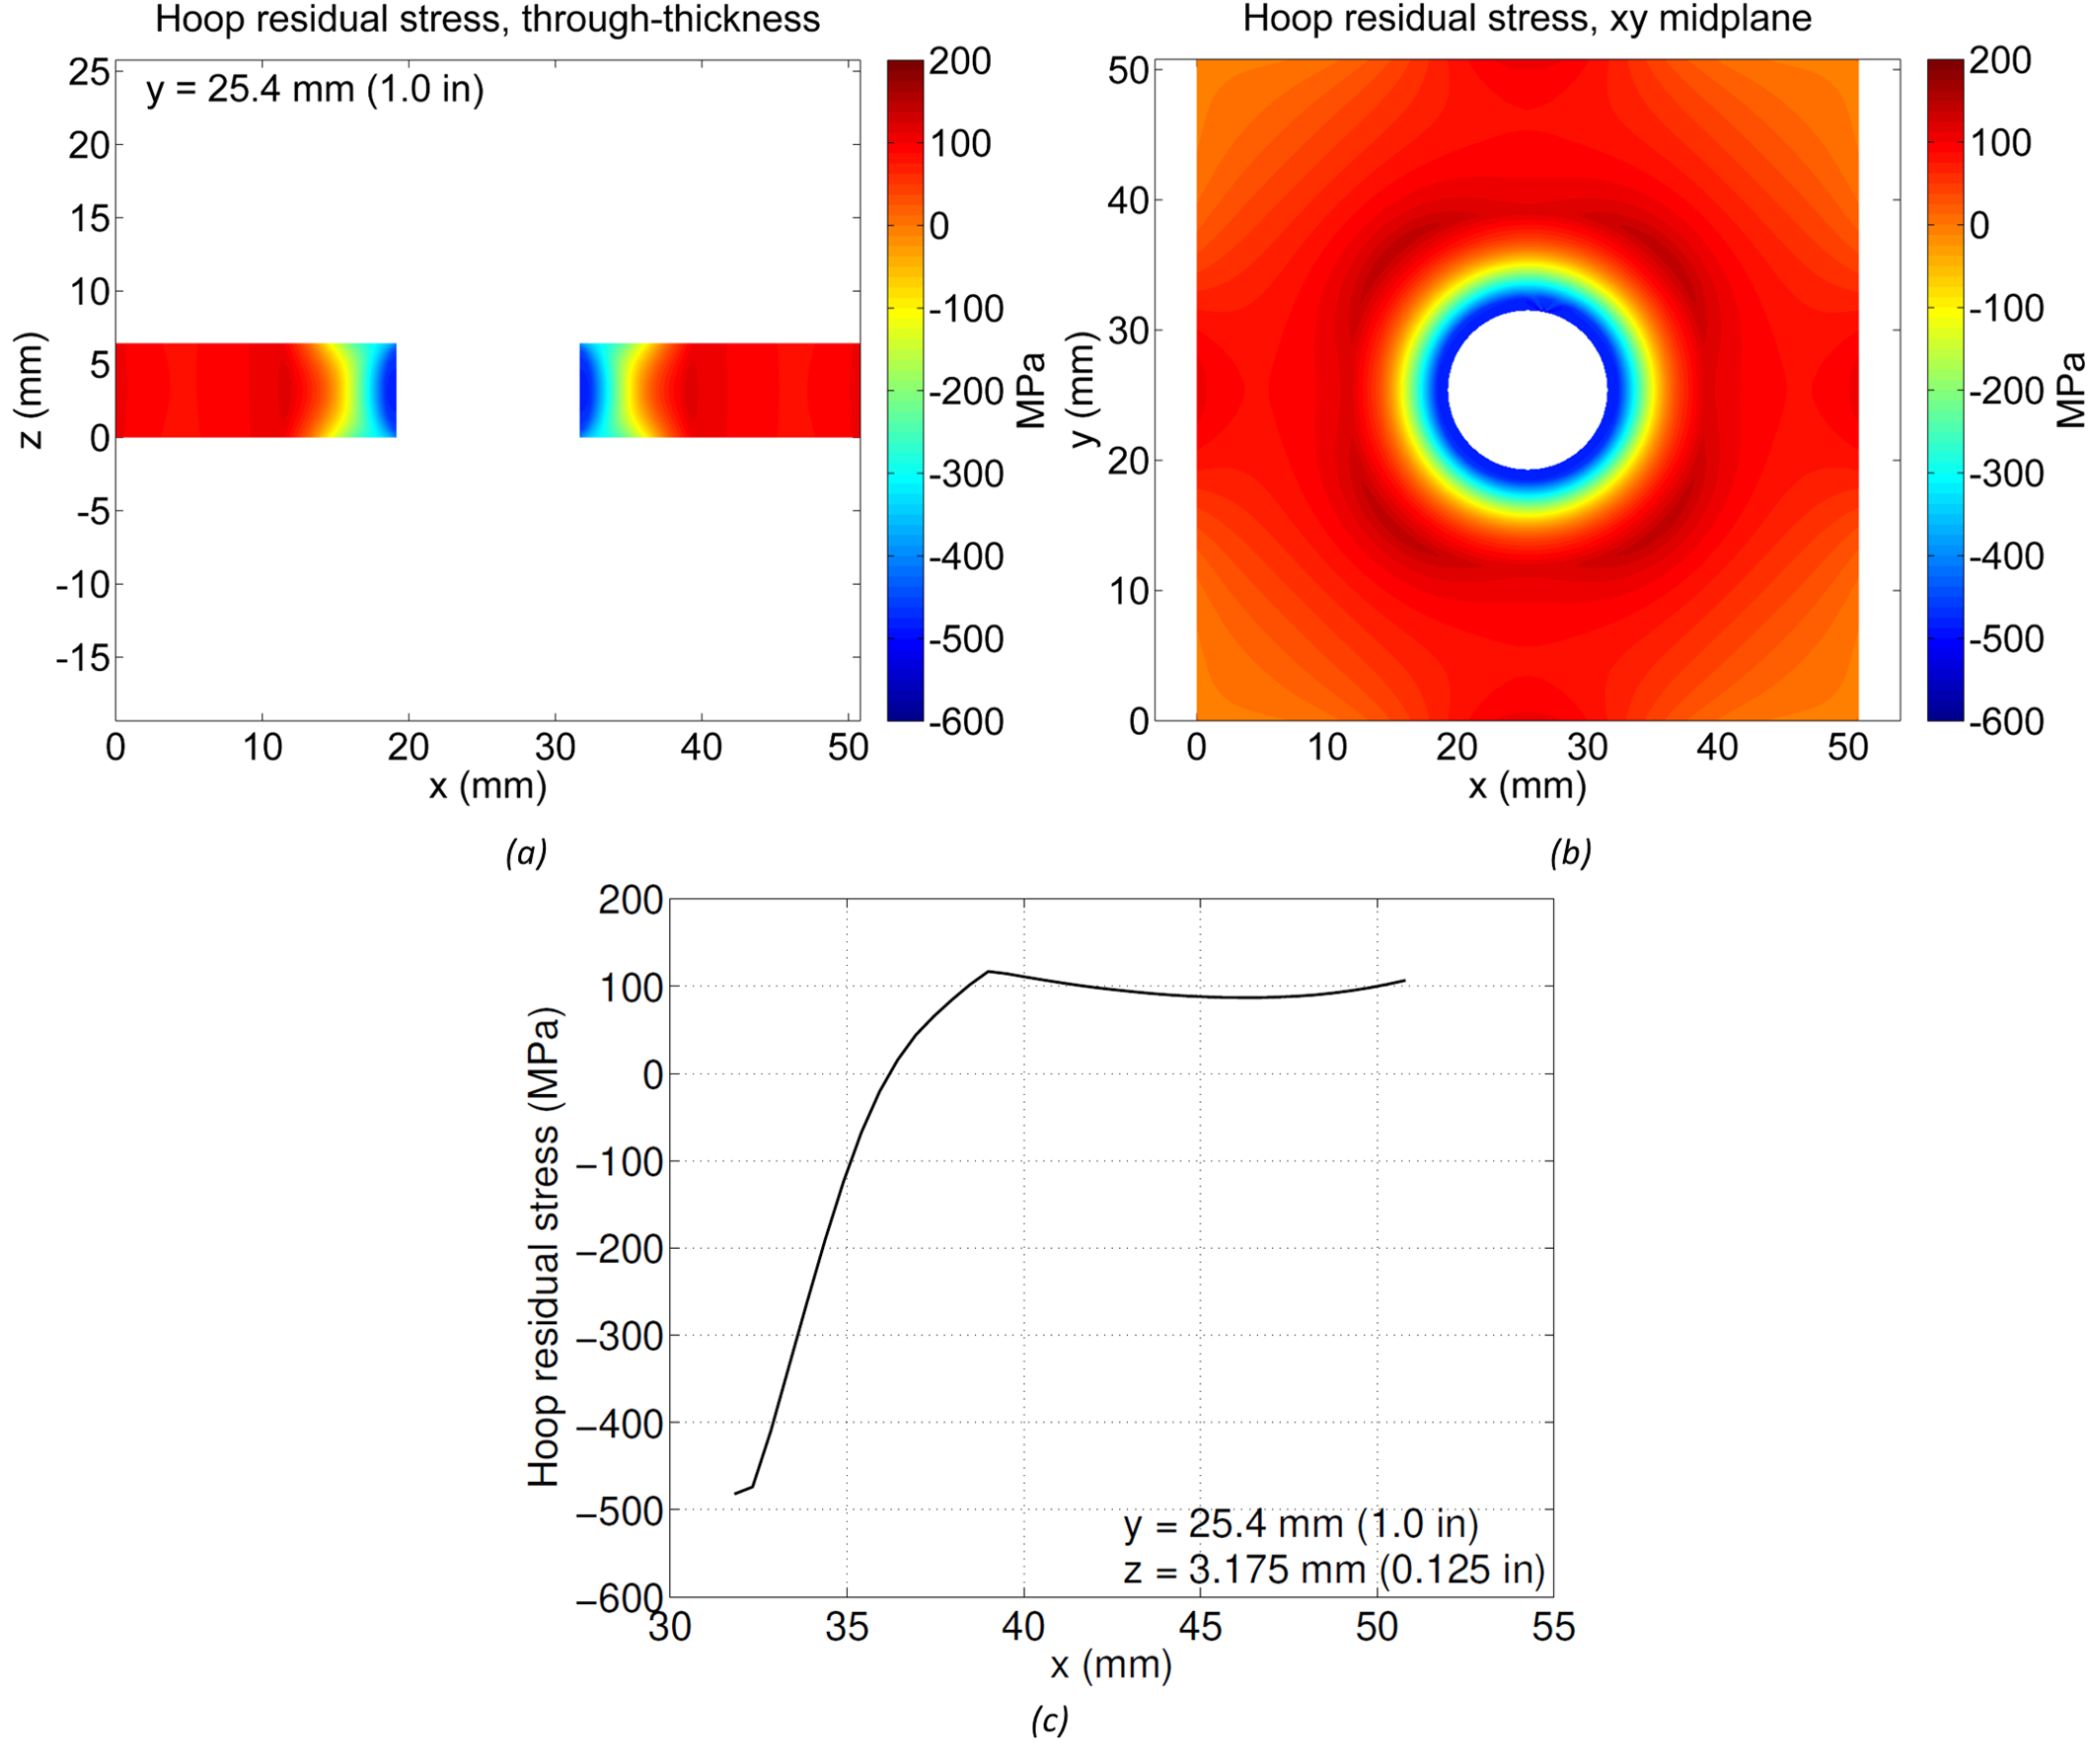
Hoop residual stress from process model with 3.16% applied expansion a) through thickness of coupon, b) on xy midplane at z = 3.175 mm (0.125 inch), c) line plot along x-direction at y = 25.4 mm, z = 3.175 mm
Having the process model established above, it is useful to evaluate the effect of the radial applied expansion level in the resulting hoop residual stress. Running the process model with a 4.16% applied expansion provides hoop residual stress as shown in Figure 3. Maps of the hoop residual stress are shown in Figure 3a and Figure 3b, and show slightly higher magnitudes of residual stress compared to the results in Figure 2a and Figure 2b. Figure 3c shows the line plot along the same path as for the previous model, and compares the results obtained with both levels of expansion. Overall, the higher level of expansion resulted in about 5% increase in peak compressive residual stress at the hole edge, and a 10% increase in the size of the compressive residual stress zone around the hole.

Hoop residual stress from process model with 4.16% applied expansion a) through thickness of coupon, b) on xy midplane at z = 3.175 mm (0.125 inch), c) line plot along x-direction at y = 25.4 mm, z = 3.175 mm
This case study focuses on process modeling using finite element analysis for prediction of residual stress from cold expansion of fastener holes. A process model is developed to simulate the expansion of the hole due to the mandrel pull-through operation, and the resulting hoop residual stress after elastic recovery of the material is presented. The model results show high compressive residual stress at the edge and vicinity of the hole, which decays with distance from the hole and eventually becomes tensile. Increasing the amount of applied expansion used in the model causes an increase in peak compressive residual stress at the hole edge, as well as an increase in size of the zone of compressive residual stress near the hole. Although only the hoop residual stress results are shown here, the process model provides full field solutions, and allows for evaluating residual stress from cold expansion through numerical simulation.
For more information about the study described above, our fatigue testing abilities, or any of our residual stress measurement techniques, please contact us.
[1] Stuart, D. H., Hill, M. R., and Newman Jr, J. C., 2011, “Correlation of one-dimensional fatigue crack growth at cold-expanded holes using linear fracture mechanics and superposition,” Eng. Fract. Mech., 78(7), pp. 1389–1406.
Vlog: How to Use the Nikon ModelMaker H120 3D Scanner
Hello Readers!
If you aren’t subscribed to our YouTube channel, we’d like to announce that our latest vlog is now live. Continue reading Vlog: How to Use the Nikon ModelMaker H120 3D Scanner
Agreement with VEQTER for Deep-Hole Drilling technology
Hill Engineering, answering strong demand for its residual stress measurement services, would like to announce our agreement with VEQTER, Ltd to license the Deep-Hole Drilling (DHD) technology. VEQTER, along with the University of Bristol, aided in the development of the DHD technique, and have practiced the technology for over 25 years. With this agreement, VEQTER will provide Hill Engineering with the equipment, technology, and support to deliver state-of-the-art DHD measurements within the North and South American Continents. Continue reading Agreement with VEQTER for Deep-Hole Drilling technology
Case Study: Machine distortion modeling
We’ve recently uploaded a new case study on the topic of part distortion caused by machining. Distortion is a significant problem faced by many industries, especially where rigorous dimensional tolerances are required. When not appropriately accounted for, distortion can lead to significant economic loss and should be managed for effective design and production. Continue reading Case Study: Machine distortion modeling
Machining distortion modeling
Part distortion during machining is a significant problem in many industries, particularly where rigorous dimensional tolerances are required. Distortion of finished parts can lead to significant economic loss and should be managed for effective design and production. This case study demonstrates some of the basic concepts related to the impact of residual stress on part distortion during machining. A representative problem is defined, and a model is used to estimate part distortion due to machining of raw material containing bulk residual stress.
This study considers a 304.8 x 203.2 x 12.7 mm (12.0 x 8.0 x 0.5 inch) aluminum plate as the starting raw material for the analysis. From the plate an example part will be machined that has the same in-plane dimensions as the starting plate (304.8 mm x 203.2 mm) and includes a 2.54 mm (0.1 inch) thick frame around a 2.54 mm (0.1 inch) thick web.
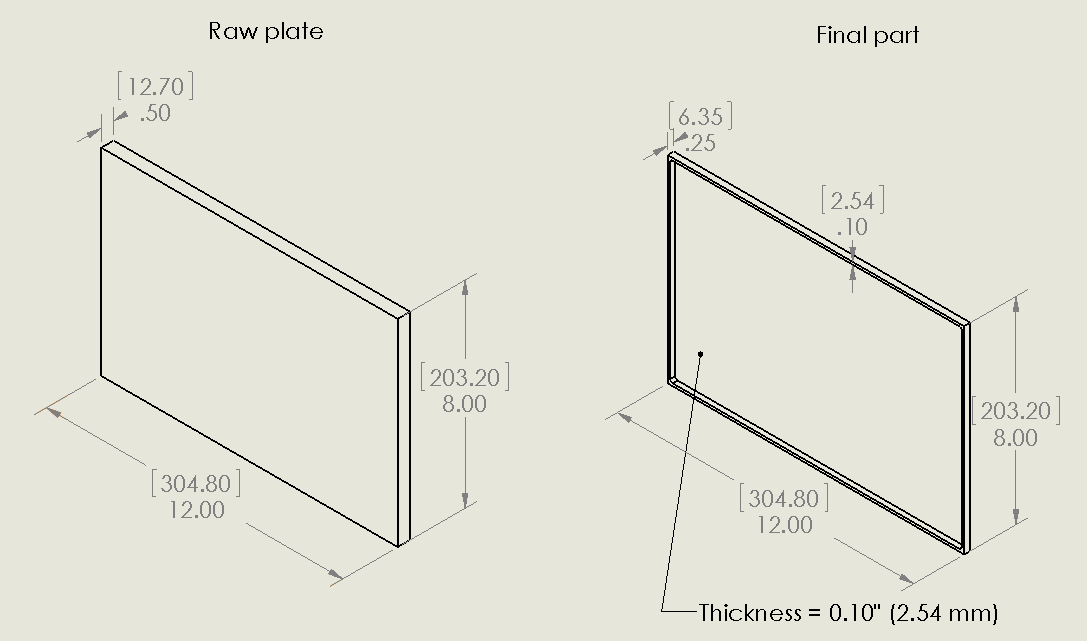
Raw plate and final part geometry. Non-bracketed dimensions are in inches and bracketed dimensions are in mm.
Aluminum plate is often stress relieved by stretching, and typically exhibits low levels of residual stress post-stress relief. For the sake of this analysis, the raw material is assumed to have the residual stress distribution shown in Figure 2a (similar to the residual stress measured by Prime and Hill [1]). The residual stress values are low compared to the yield strength of the material, ranging from about -20 to 20 MPa (-3 to 3 ksi).
In addition to the bulk residual stress present in the raw material, the machining process also induces stress. The machining-induced residual stress assumed for this demonstration is shown in Figure 2b, and exhibits a typical distribution with compressive residual stress near the machined surface that spans over a thin layer (0.2 mm) before it reaches magnitudes near zero. The peak compressive residual stress at the machined surface is -50 MPa (~ 7.3 ksi). The bulk residual stress in Figure 2a is assumed to be present in the raw plate for the analysis, while the machining-induced residual stress in Figure 2b is applied locally to the machined surfaces.
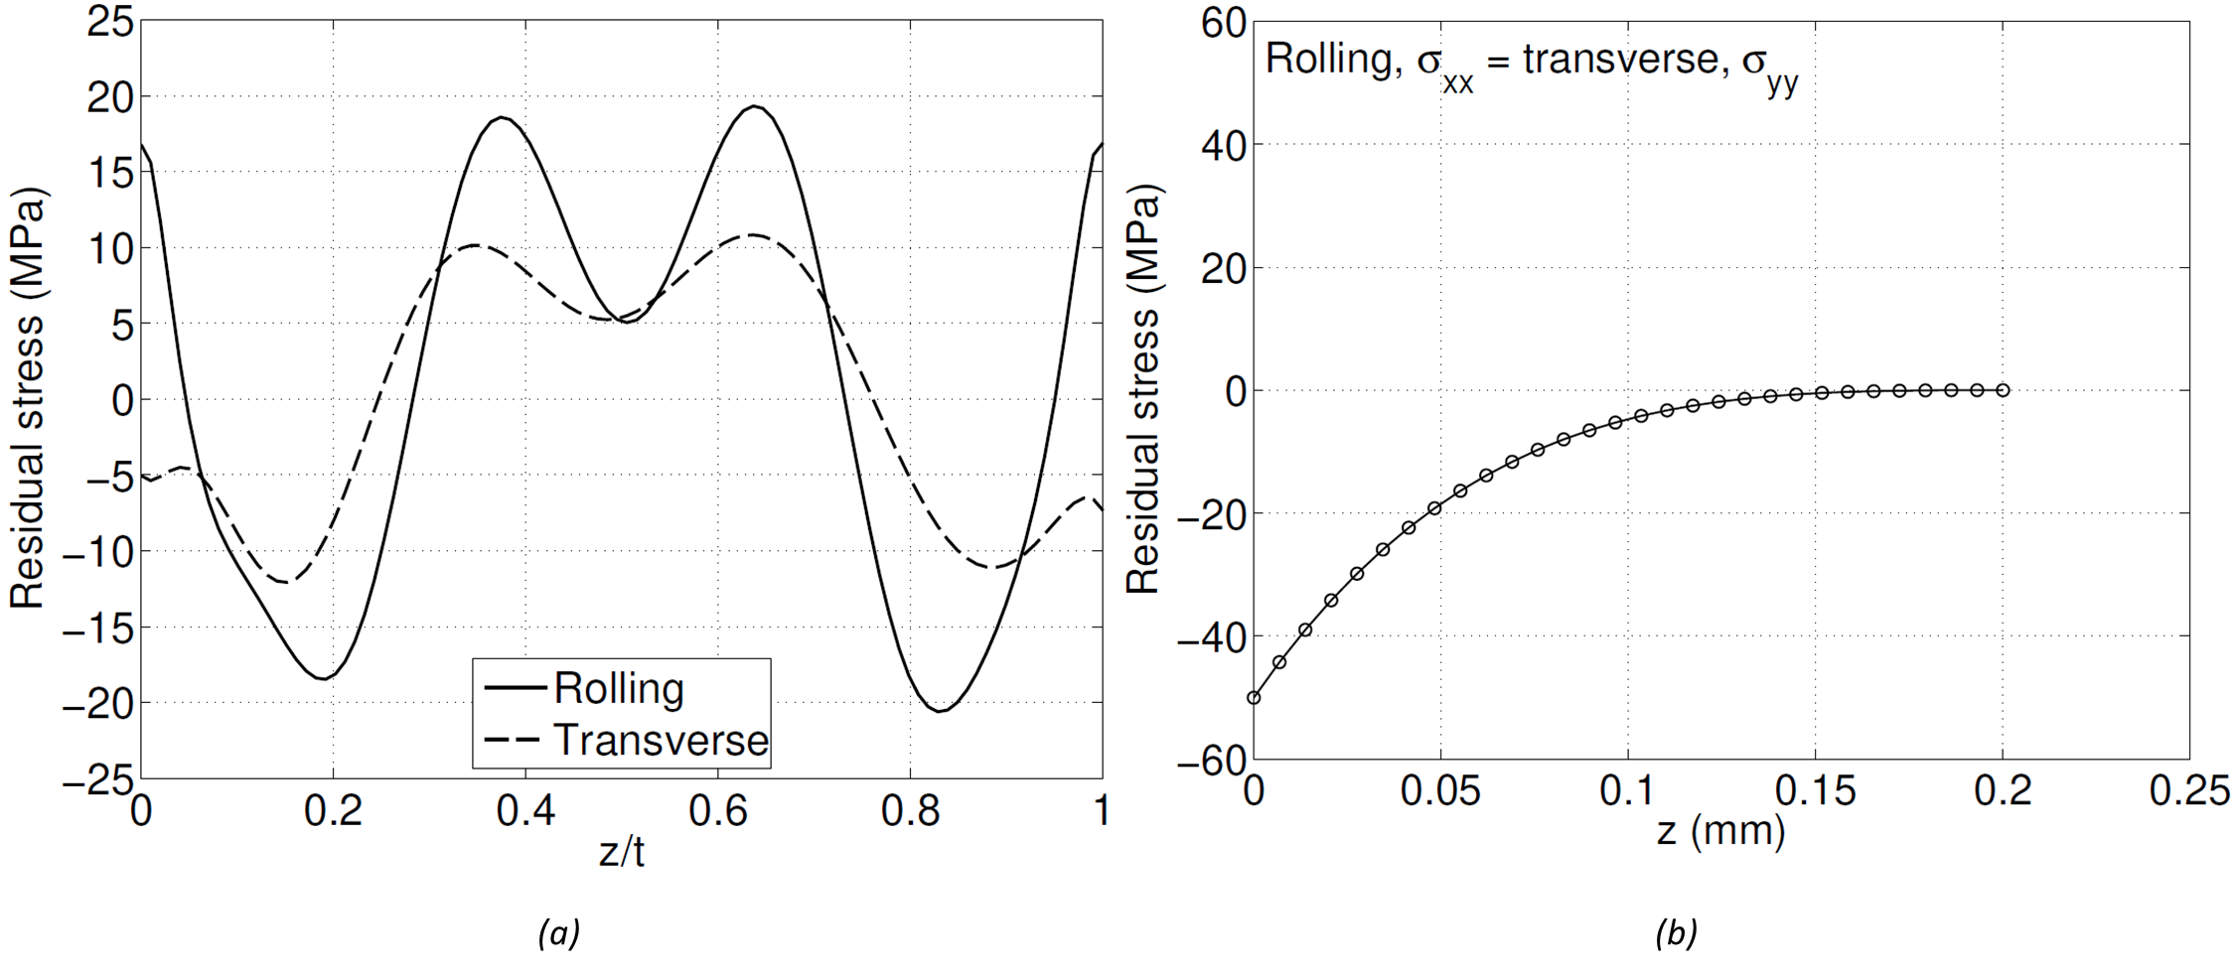
(a) Bulk residual stress (similar to [1] along rolling and transverse direction, (b) idealized machining induced residual stress
A finite element model including the bulk and machining-induced residual stresses was used to predict the distortion of the finished part. The model is elastic and superposes bulk and machining residual stress to provide an equilibrium solution. Figure 3a shows the deformed shape (using a magnification factor of 30 to better illustrate the deformation). The displacement pattern shows bowing of the finished part with respect to its intended shape, with positive displacements near the center. A 2D map of the displacement of the bottom surface of the finished part is shown in Figure 3b. Line plots along the x direction at y = 101.6 mm and along the y direction at x = 152.4 mm are shown in Figure 3c. The distortion range is approximately 1.4 mm. It is important to note that even though the bulk residual stress in the raw material is low (about 5% of the yield strength), it still has potential to cause significant distortion in finished parts, as illustrated here.
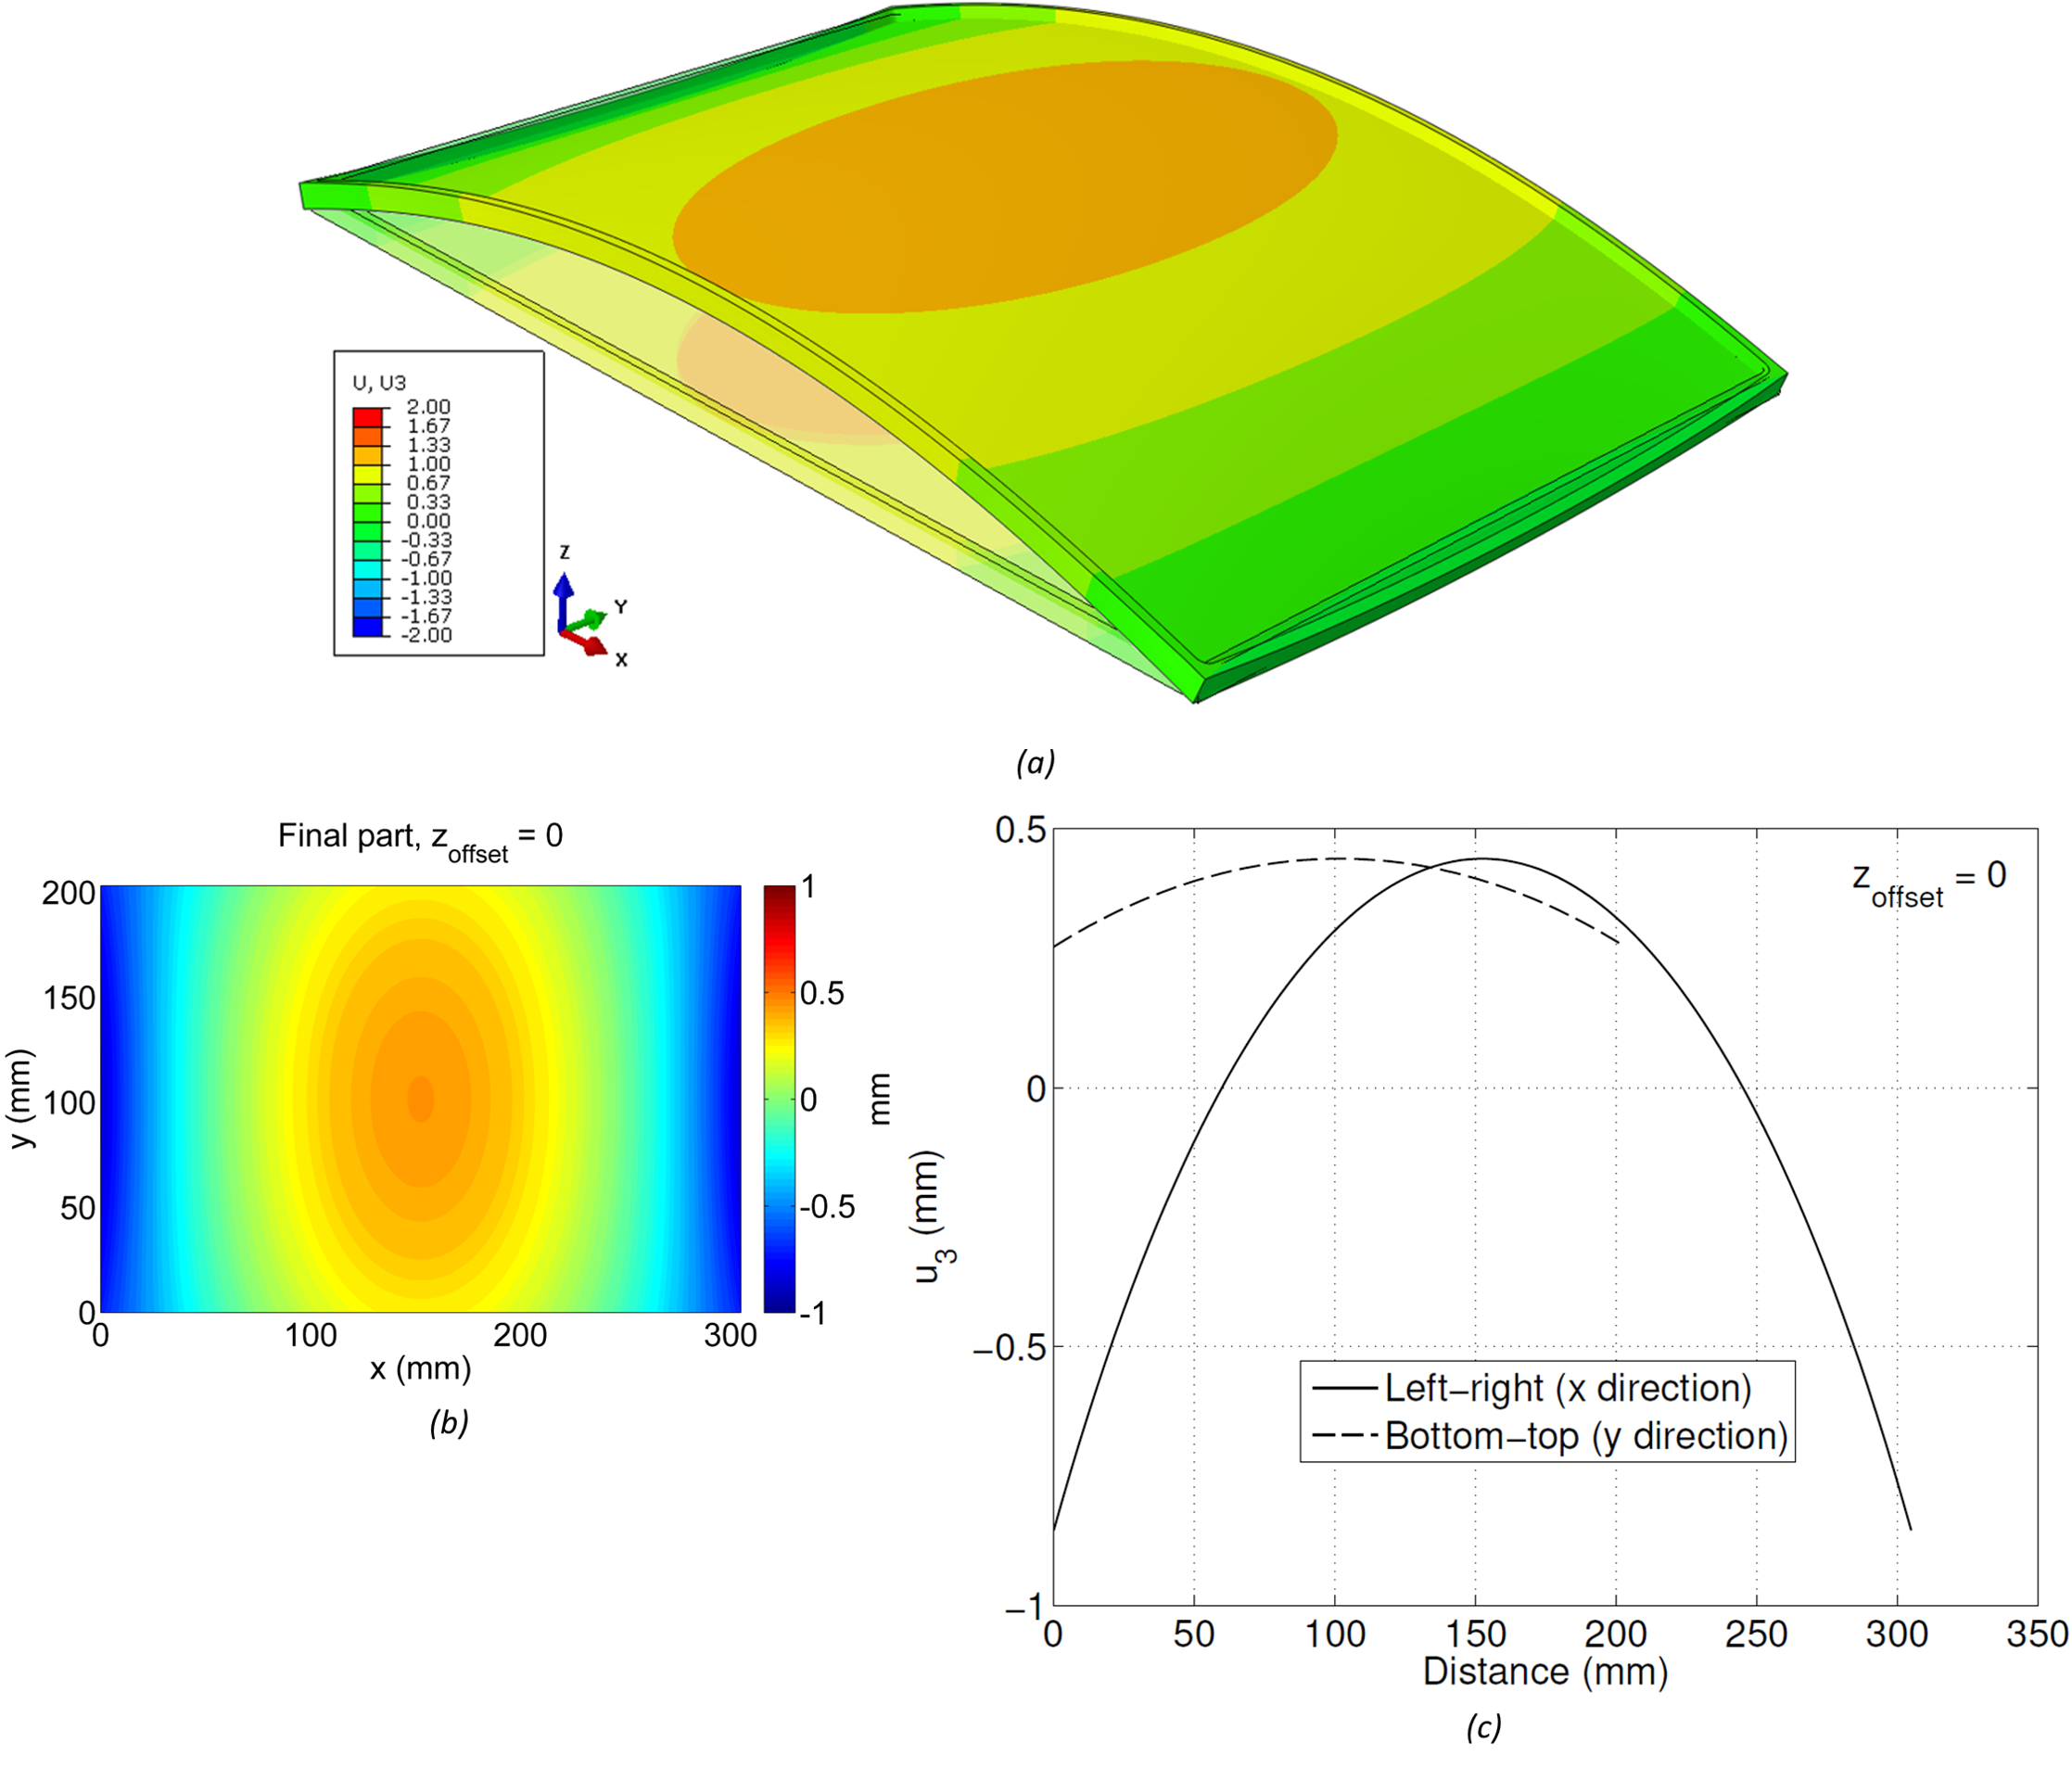
(a) Undeformed/deformed 3D shape of final part with zoffset = 0, (b) 2D map of leveled displacement of bottom surface, (c) line plots along paths from left-right and bottom-top
Since the raw plate is thicker than the final part, the final part can be extracted from different positions through the thickness of the raw plate (e.g., Figure 4). The position from within the raw plate that the final part is removed from can have a significant impact on the distortion (due to the different bulk residual stress levels at different locations through the thickness). The position is defined by an offset distance from the bottom surface of the raw plate, zoffset. In the first example, the zoffset = 0, i.e., the bottom surface of the final part is aligned with the bottom surface of the raw plate (z = 0).
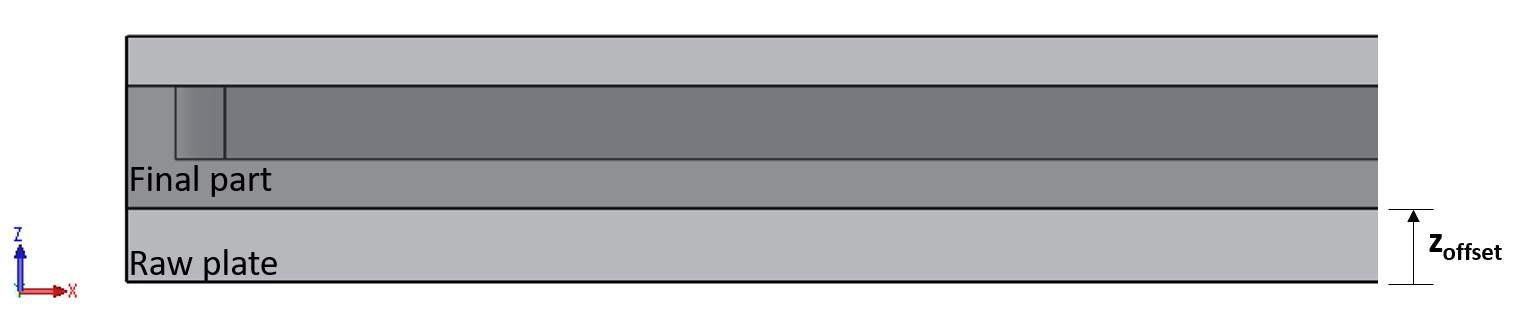
Location of machining of baseline/final part within the raw plate
The model used here can be modified to consider different part placements within the raw material in a straightforward manner. A significantly different result was obtained considering zoffset = 2.54 mm (0.1inch), which is shown in Figure 5. An opposite pattern of distortion is observed in Figure 5a compared to the case where zoffset = 0 (Figure 3a). The 2D map shown in Figure 5b shows displacements that range from 1.1 mm to -0.6 mm. Figure 5c shows the displacement along the left-right and bottom-top paths, and includes the results obtained with zoffset = 0 for comparison. Compared to zoffset = 0, zoffset = 2.54 mm exhibits displacement along the x direction that ranges from positive-negative-positive values and with higher magnitudes. The displacement along the y direction is similar for both offsets, but have opposite signs.
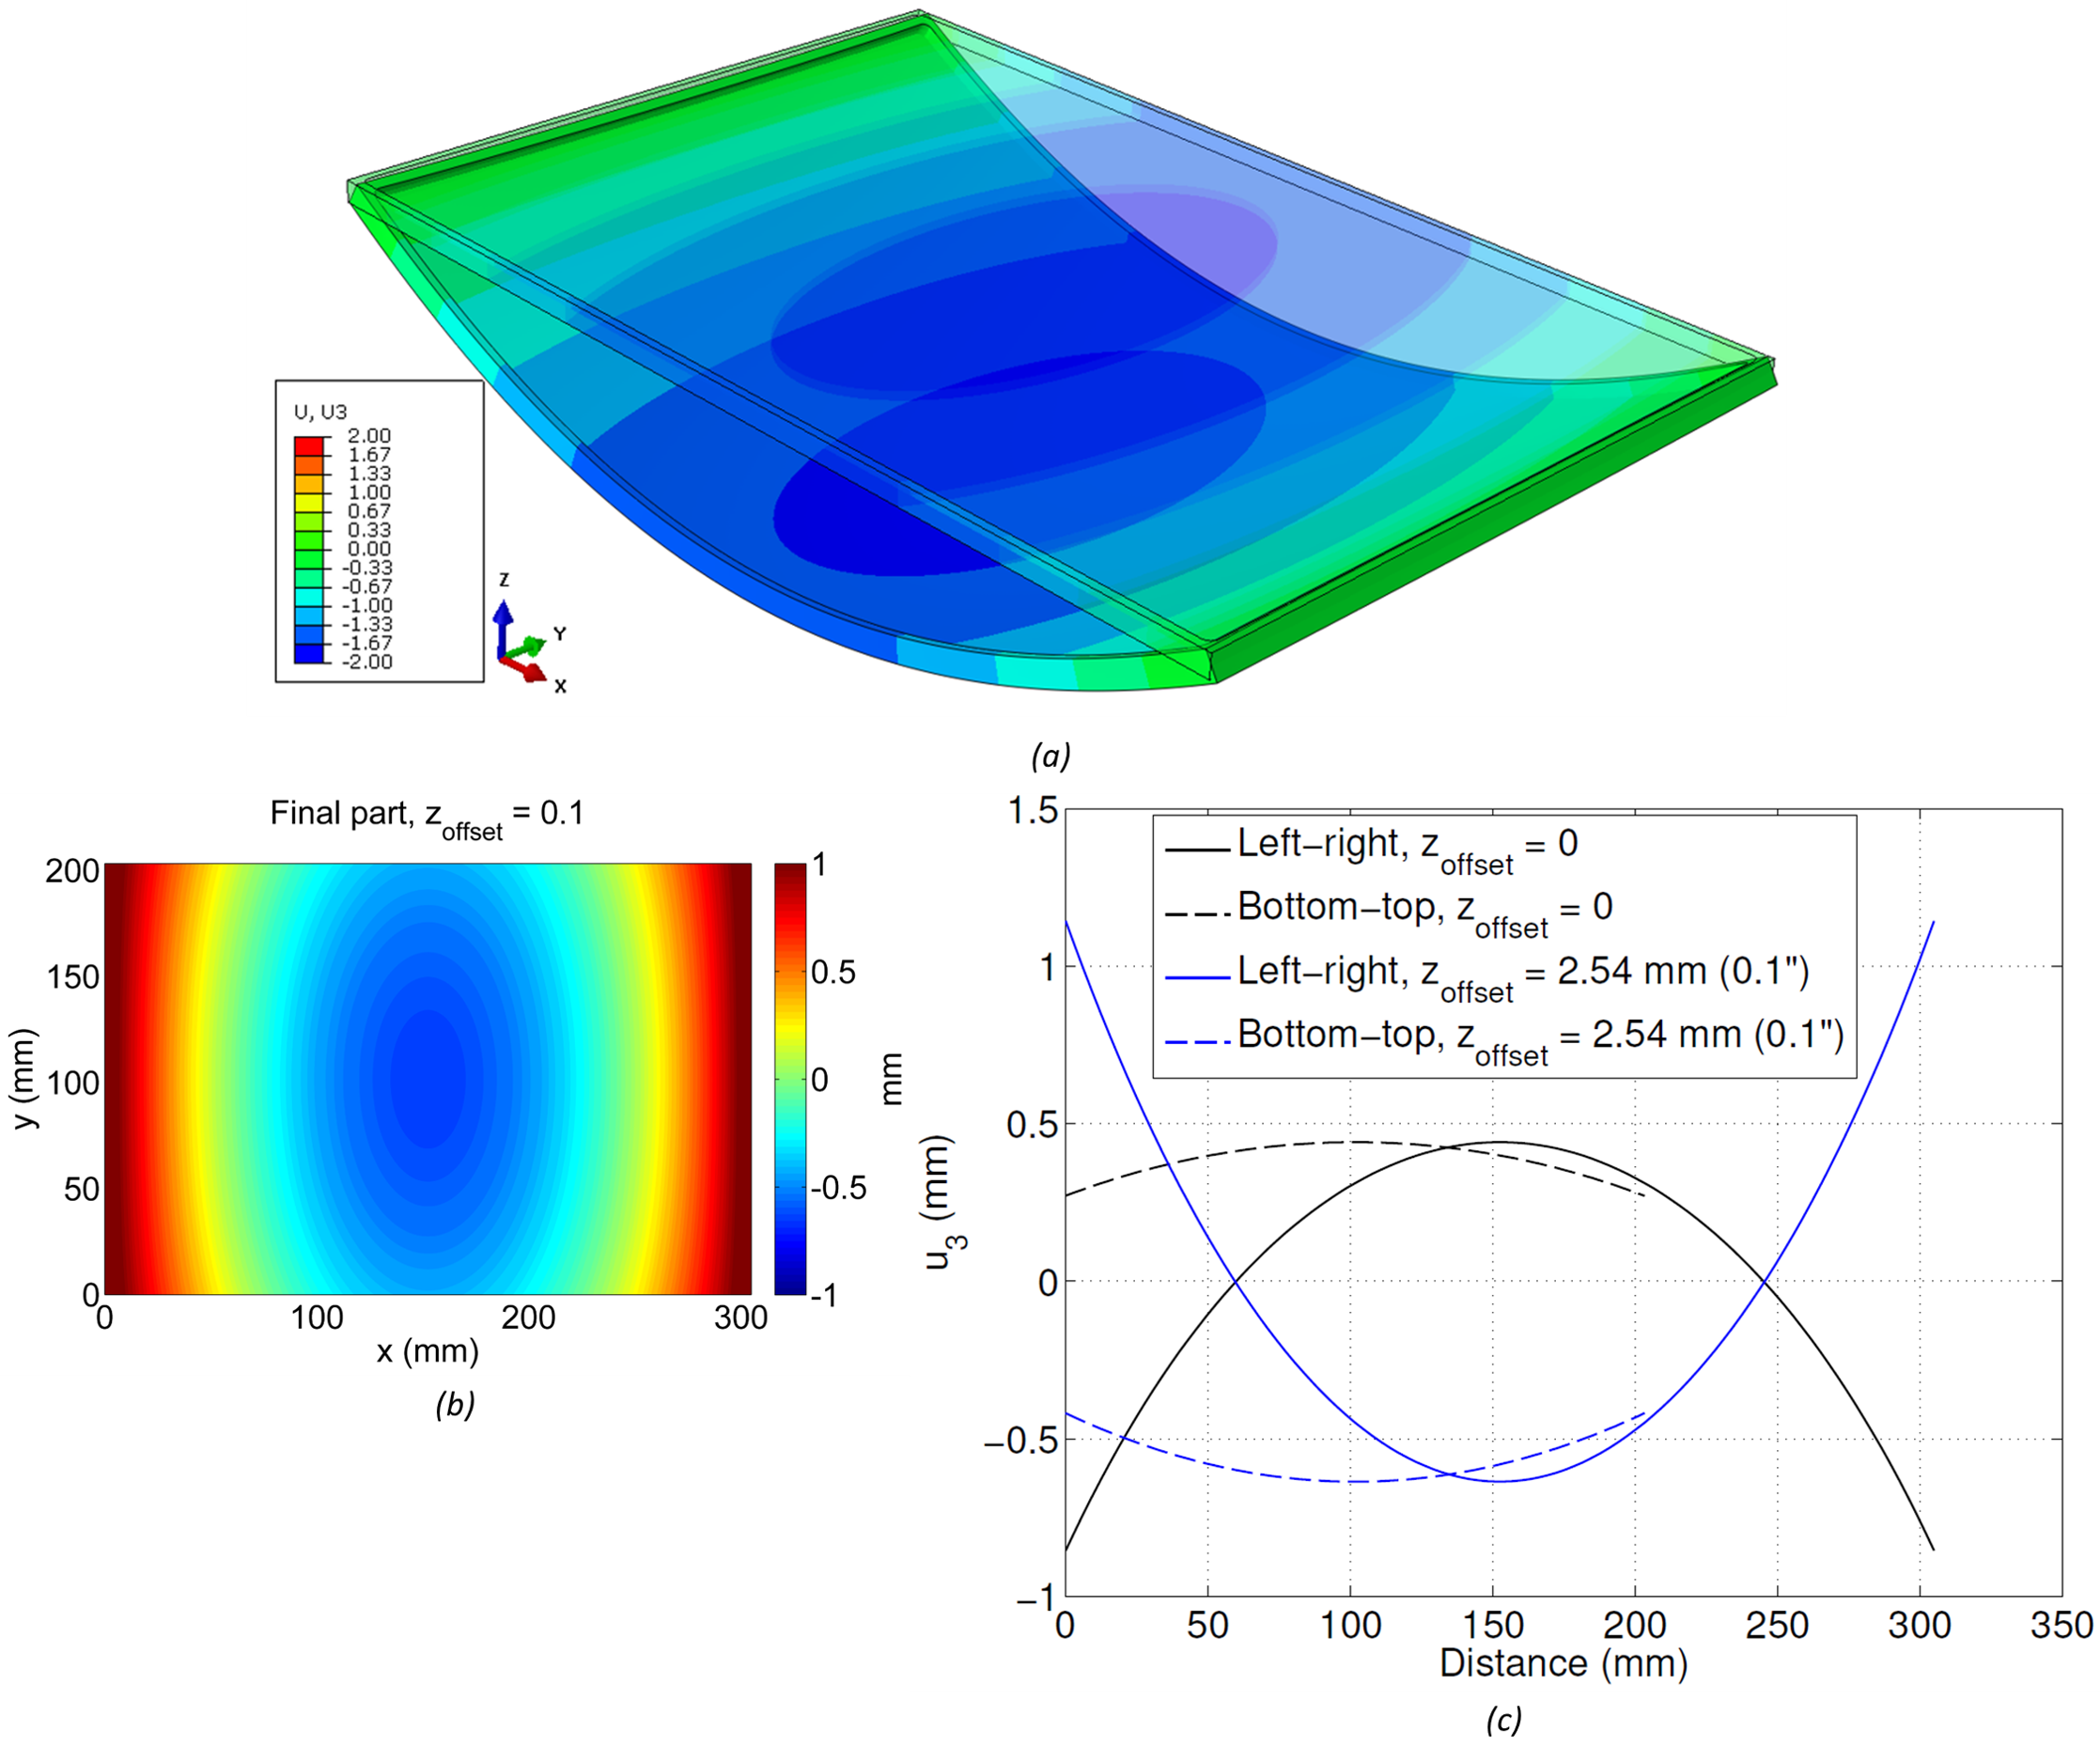
(a) Undeformed/deformed 3D shape of final part with zoffset = 2.54 mm (0.1inch), (b) 2D map of leveled displacement of bottom surface, (c) line plots along paths from left-right and bottom-top comparing zoffset = 0 and 2.54 mm
Another aspect that influences the part distortion is the thickness of the web of the large pocket. The previous results considered a thickness of 2.54 mm (0.1inch), as illustrated in the final part drawing in Figure 1. Reducing the thickness to 0.635 mm (0.025inch) and considering the zoffset = 0 configuration causes significant changes in the results, as observed in Figure 6. A similar pattern of distortion is observed in Figure 6a and Figure 6b compared to Figure 3a and Figure 3b, however the magnitudes of displacement are significantly lower. A line plot comparing the results obtained with both thicknesses is shown in Figure 6c. Overall, the model with reduced thickness (red lines) provides lower displacement magnitudes along both paths (left-right and bottom-top) compared to the initial model with 2.54 mm thickness, and exhibits peak displacement that is lower by about 50%.
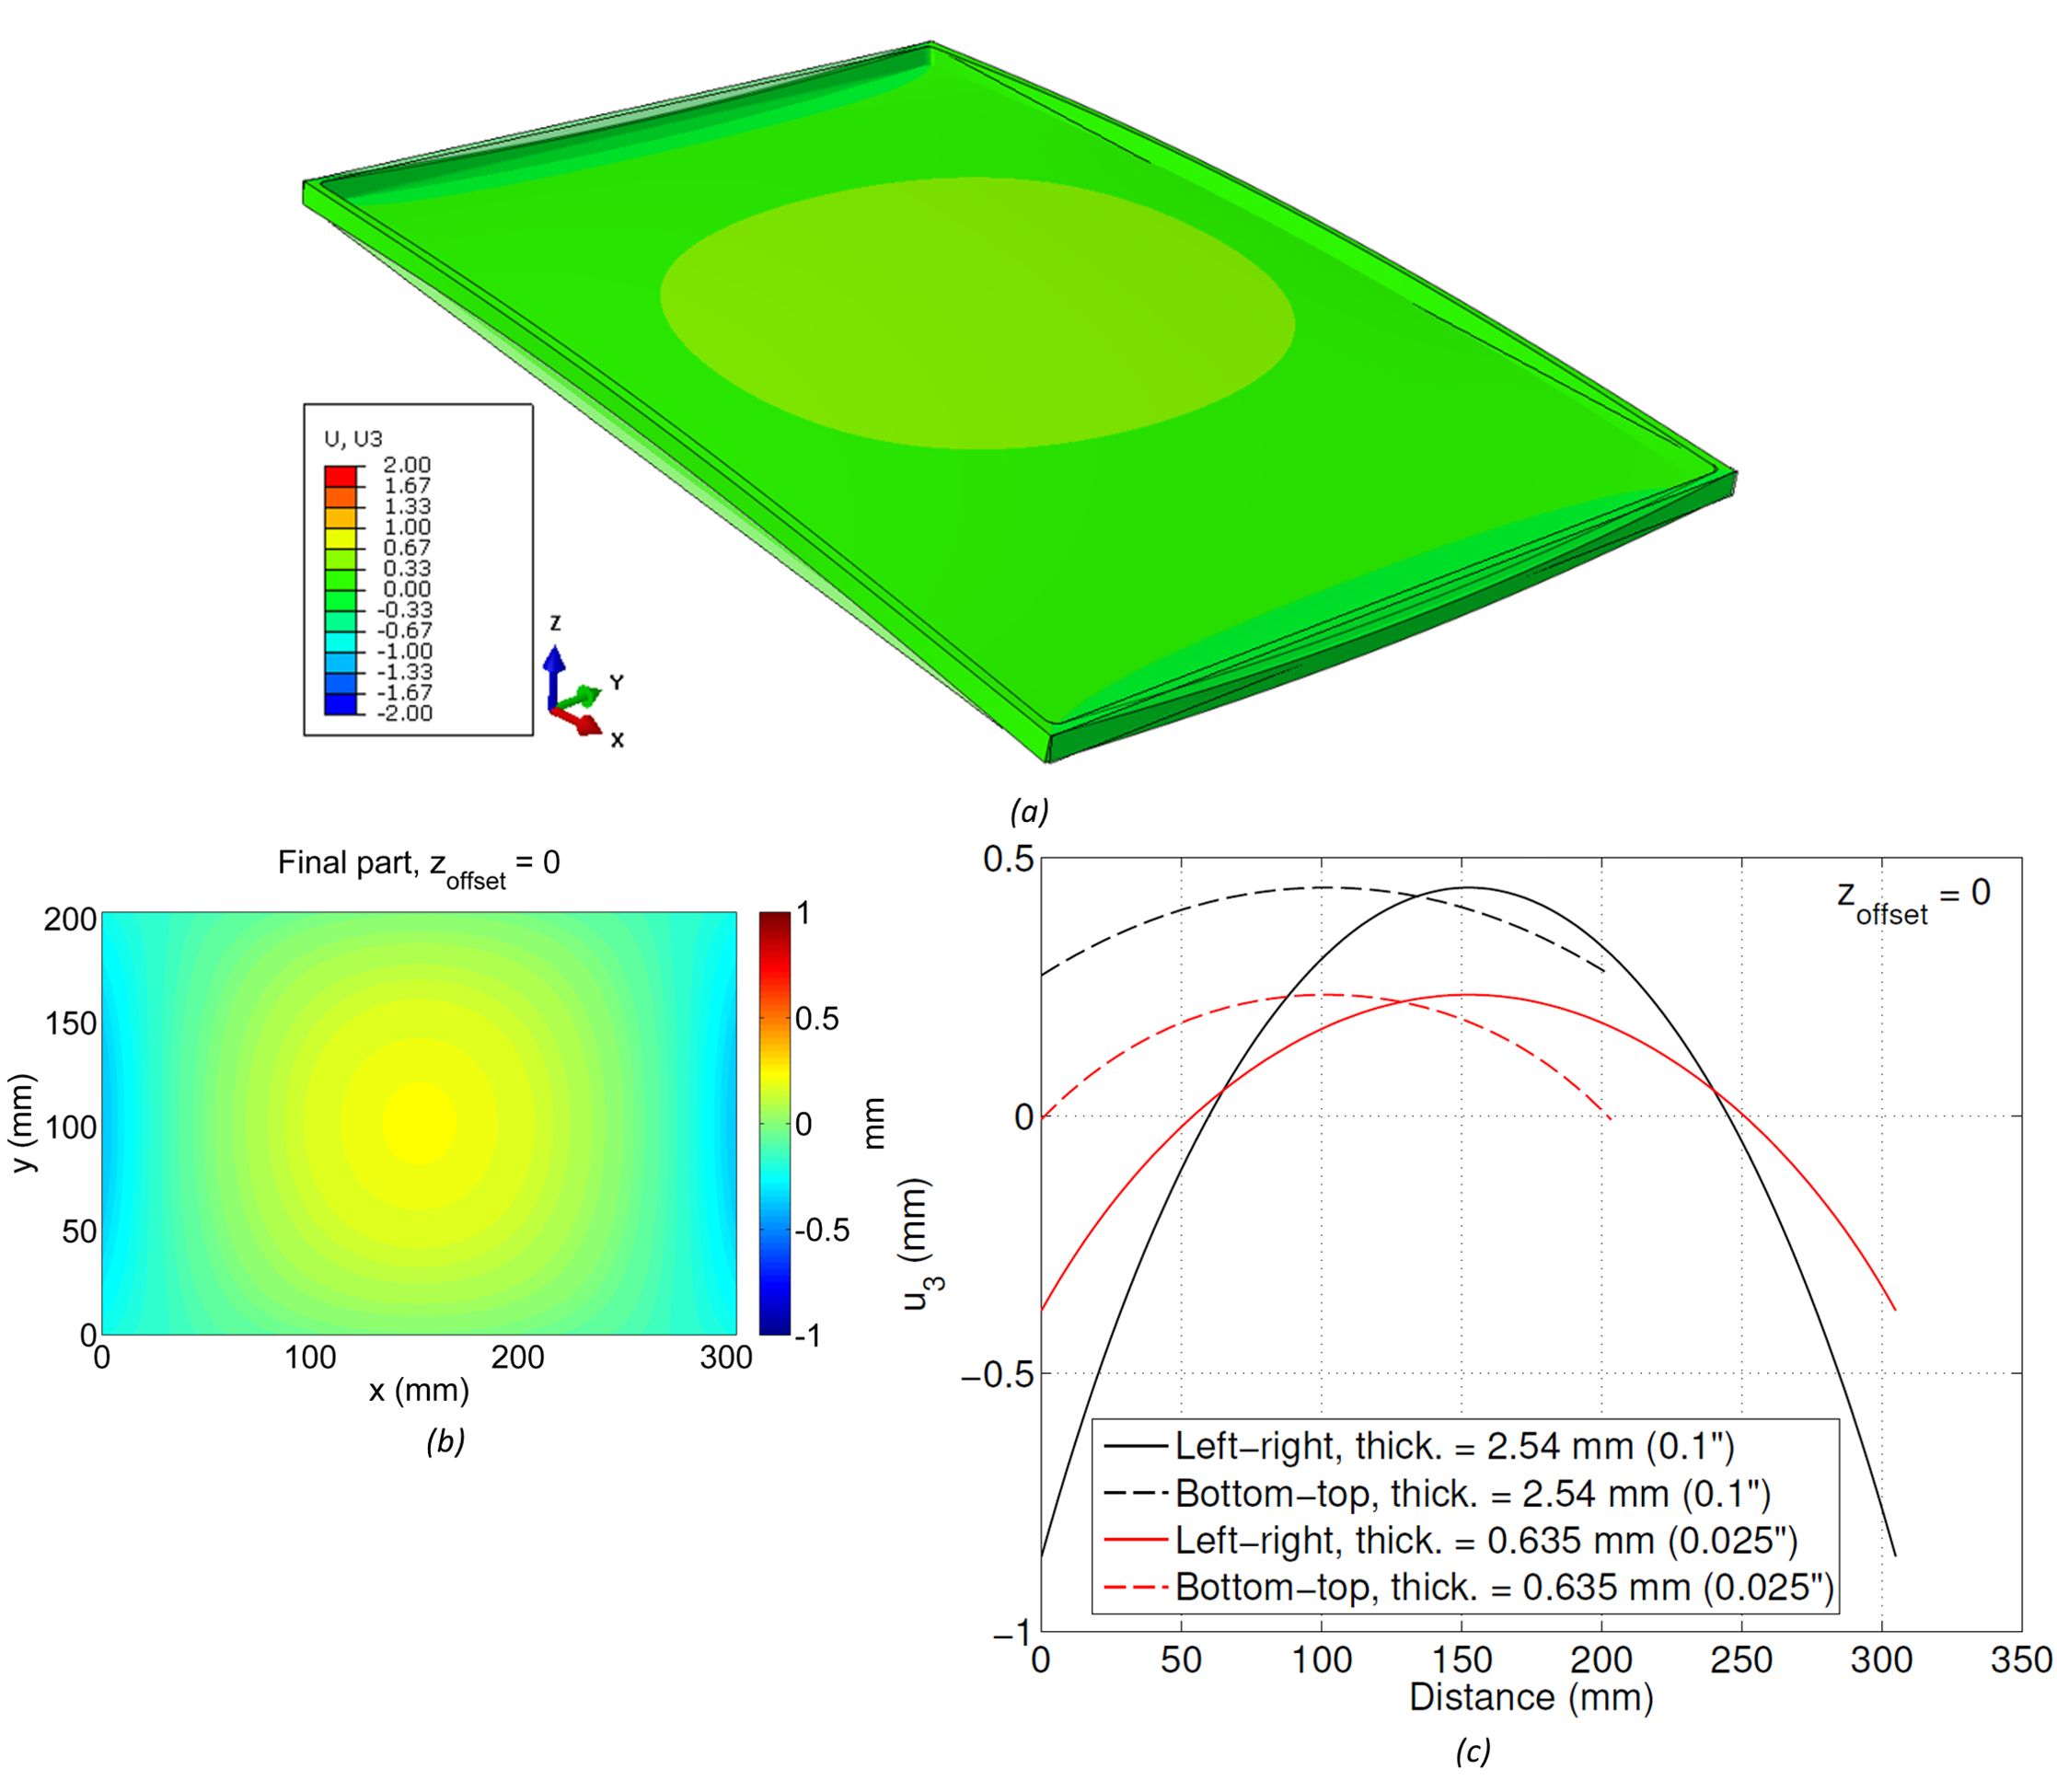
(a) Undeformed/deformed 3D shape of final part with zoffset = 0, (b) 2D map of leveled displacement of bottom surface, (c) line plots along paths from left-right and bottom-top comparing thickness = 0.635 mm (0.025inch) and 2.54 mm (0.1inch)
This case study provided an example problem for the estimation of part distortion due to residual stress release from machining, considering a typical bulk residual stress distribution and machining-induced residual stress distribution. The results show significant part distortion, even though the considered bulk residual stress had very low magnitude compared to the yield strength of the material. The results also show that part distortion varies significantly depending on the machining location within the raw stock material.
For more information concerning this case study or any of the residual stress measurement techniques employed at Hill Engineering, feel free to contact us.
[1] M. B. Prime and M. R. Hill, “Residual stress, stress relief, and inhomogeneity in aluminum plate,” Scripta Materialia, pp. 77-82, 2002.
Hill Engineering introduces ExpressRS
| For materials engineers, designers, and managers seeking residual stress measurements, Hill Engineering is a trusted source for a broad range of best-in-class measurement capabilities. But while we always strive to deliver quality results in a timely manner, sometimes a job requires a faster than normal turn-around. This is why we’ve introduced ExpressRSTM, a service geared toward expedited delivery of residual stress measurement results. Continue reading Hill Engineering introduces ExpressRS |
Case Study Highlight: 3D Scanner
Hill Engineering recently installed a Nikon ModelMaker H120 3D scanner, which is proving to be very useful in our laboratory. In addition to scanning services we now offer to outside parties, we’ve also implemented this technology into our residual stress measurement processes. This new capability allows us to produce faster, more accurate results than ever before. Continue reading Case Study Highlight: 3D Scanner